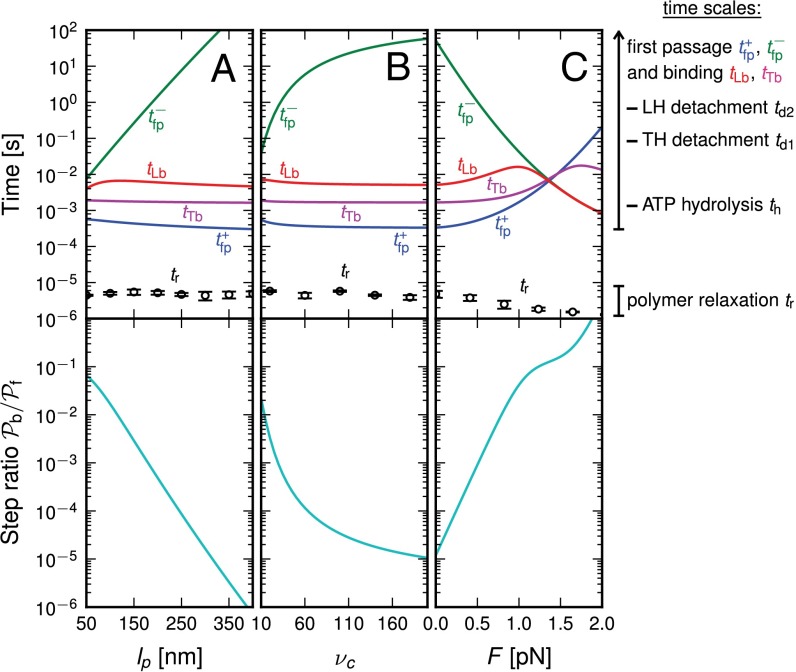
Fig. 2.
(Upper) Theoretical predictions for the mean first passage time  to the forward (+) and backward (−) sites; the mean binding times tLb and tTb for the L and T legs, respectively; and the polymer relaxation time tr for the MyoV structure to equilibrate after the detachment of one leg. All results except tr are derived from the analytical theory. The relaxation times are estimated using coarse-grained Brownian dynamics simulations (details are provided in SI Text). (Right) Main time scales in the problem are summarized, with their values (or ranges) indicated for comparison. (Lower) Ratio of backward to forward steps,
  . For the three columns, the quantities are plotted as one parameter is varied, whereas all others are fixed at their Table 1 values: leg persistence length lp (A), power stroke constraint strength
  (B), and load force F (with
  ) (C).

