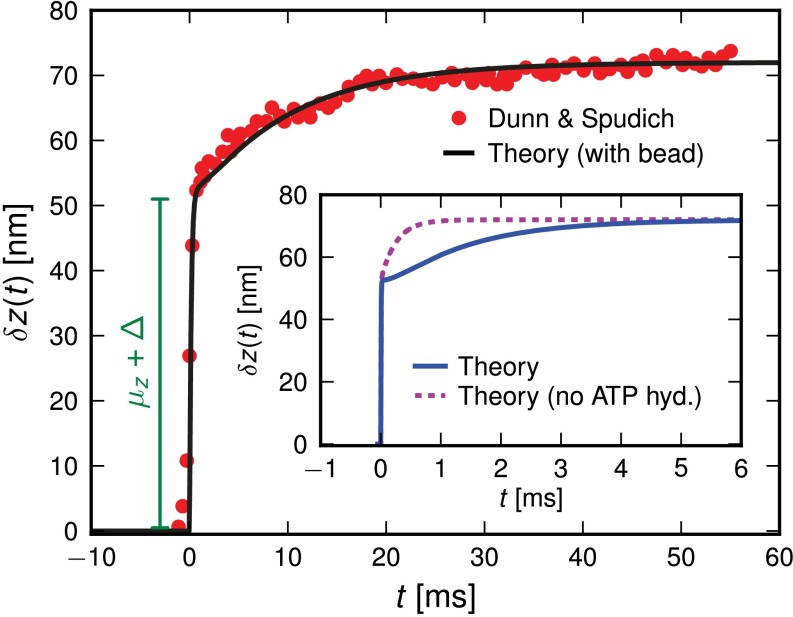
Fig. 3.
Mean step trajectory  of the detached head along the actin filament at zero load. Red dots are the experimental results of Dunn and Spudich (23), obtained by tracking a gold nanoparticle attached near the end of the MyoV lever arm. A fast rise occurs over a distance
  , resulting from the polymer structure relaxing to equilibrium after TH detachment. The more gradual rise that follows corresponds to the diffusive search for the forward binding site. The solid curve is the theoretical prediction, corrected for the slowing down of relaxation and first passage dynamics due to the particle. (Inset) Result of the original theory without the correction (solid curve), compared with a variant of the theory where ATP hydrolysis (hyd.) is removed as a condition for the TH to bind (dashed curve).

