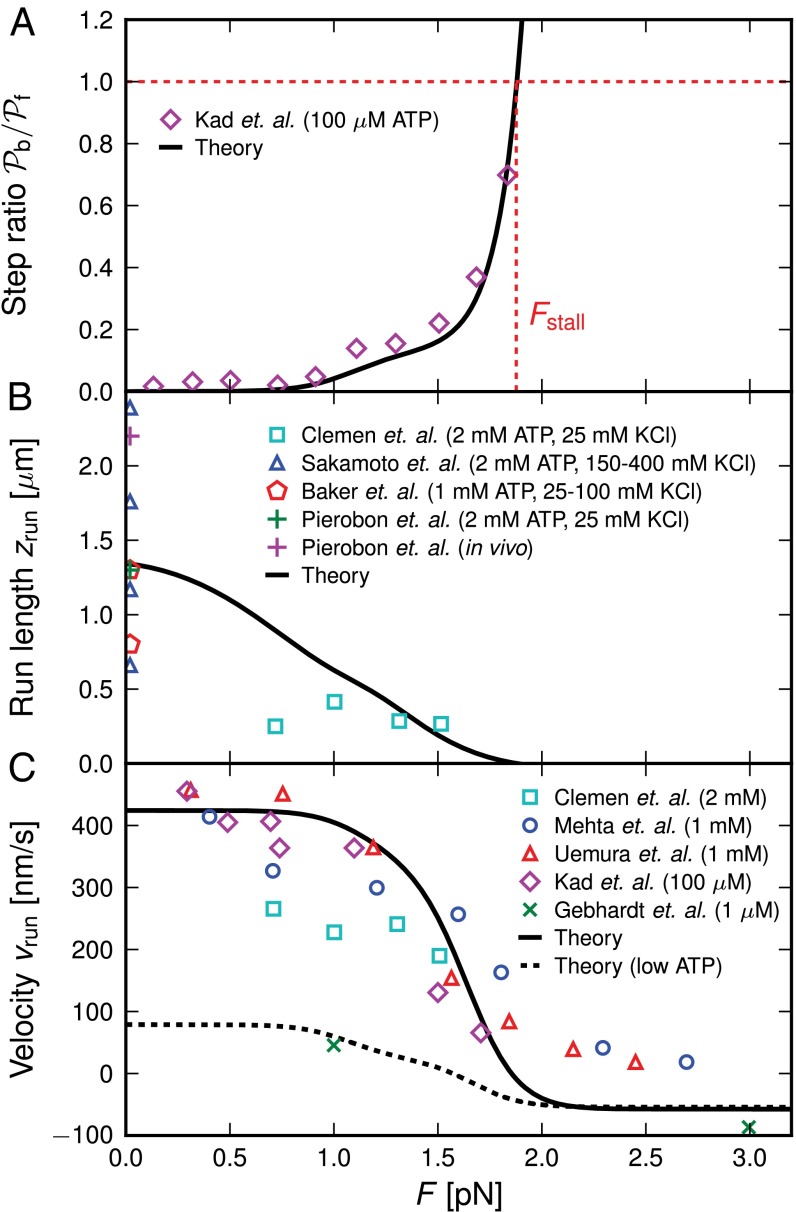
Fig. 4.
Comparison of the theory predictions (solid curves, with parameters in Table 1) to experimental results (symbols) as a function of load force F (with  ). For the legends, the first and second terms in the parentheses correspond to experimental ATP and KCl concentrations, respectively. Where the KCl concentration is not indicated, the value is 25 mM. (A) Ratio of backward to forward steps,
  , compared with the data of Kad et al. (16). (B) Run length, zrun, compared with the data of Sakamoto et al. (6), Baker et al. (10), Pierobon et al. (11), and Clemen et al. (36). (C) Velocity, vrun, compared with the data of Mehta et al. (4), Kad et al. (16), Uemura et al. (17), Gebhardt et al. (18), and Clemen et al. (36). The dashed curve corresponds to a modified version of the theory, which accounts for the low ATP concentration in the experiment of Gebhardt et al. (18) (main text).

