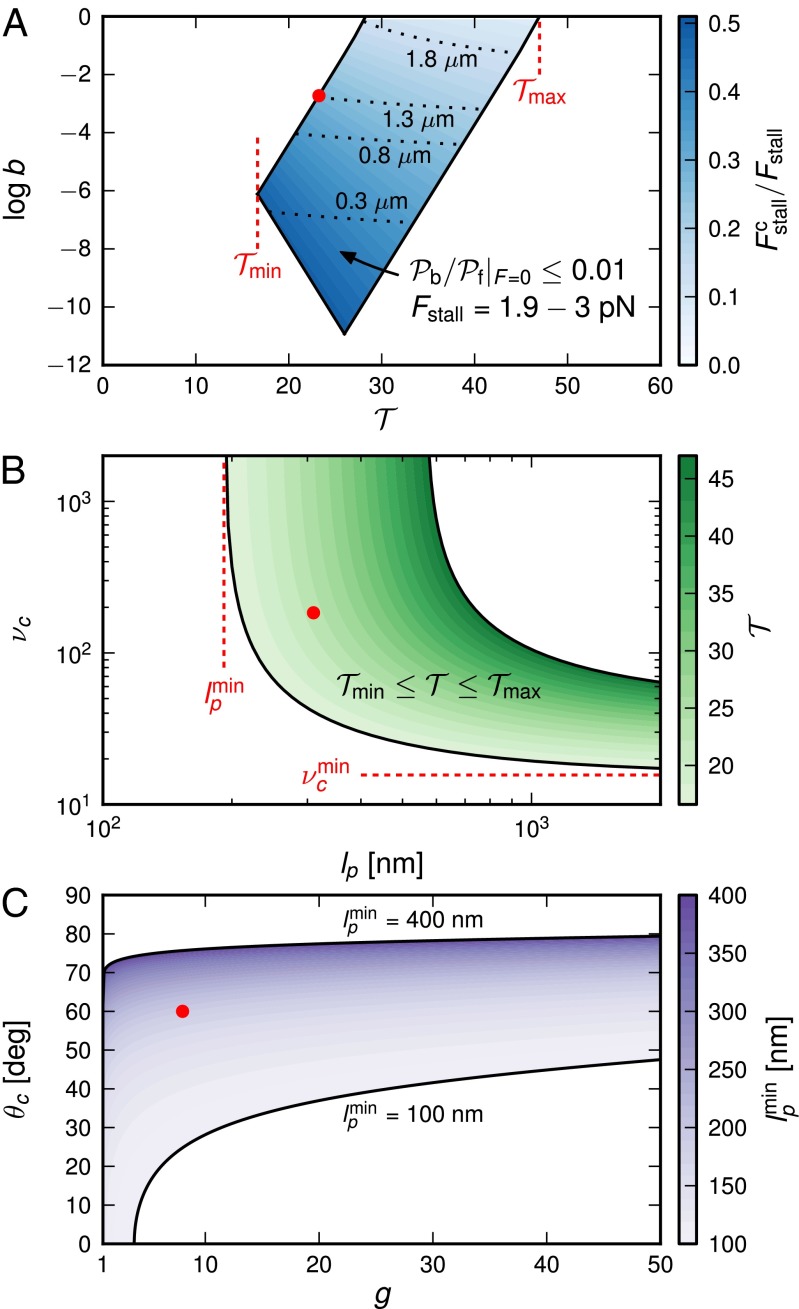
Fig. 5.
Exploring the design space for MyoV satisfying the constraints that  and that the stall force
  be in the range of
  . The red dot in each panel corresponds to the parameter set in Table 1. (A) Blue-shaded region shows the allowed values for the binding penalty b and power stroke effectiveness
  (Eq. 3). The intensity of the shading indicates the fraction
  , where
  is the contribution of head chemistry to the total stall force (Eq. 10). The labeled black dotted lines correspond to loci of constant run length zrun. The blue-shaded region falls entirely within the range of
  to
to  along the
  axis. (B) Green-shaded region corresponds to those values of persistence length lp and power stroke strength
  that yield
  in the range of
  to
to  . The intensity of shading indicates the magnitude of
  . Below the values
  and
and  , it is impossible to satisfy the bounds on
  . (C) Purple-shaded region corresponds to values of the gating ratio g and power stroke constraint angle
  that yield
  from
from  , with the shading intensity proportional to
  .
.

