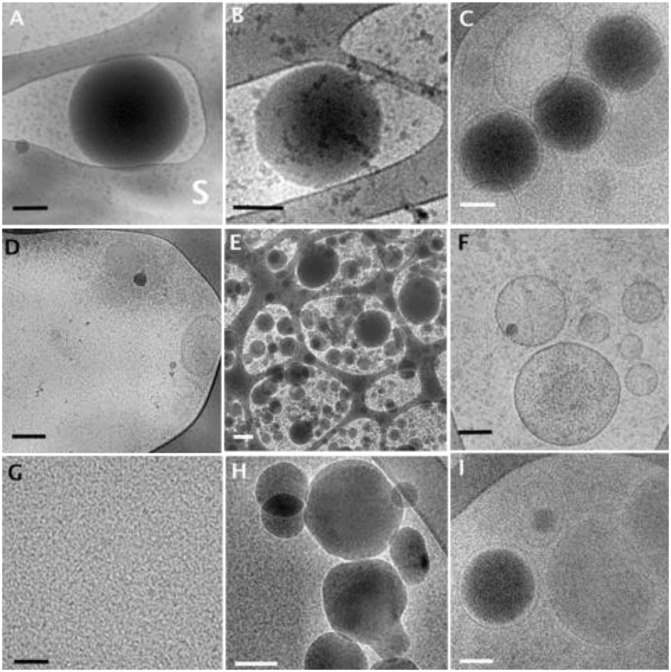
Fig. 3.
Cryo-TEM images of Lipiodol NCs. (A and B) Control Lipiodol NCs (A) in water; S denotes the perforated carbon support film. (B) In rat plasma. (C) Rat plasma at 6 h following i.v. administration of Lipiodol NCs into the jugular vein. (D–F) Extract of rat abdominal mesenteric lymph nodes at different time intervals following oral administration by gavage of embedded Lipiodol NCs in MP formulation: at 0 h (D); with nonspecific structures, at 0.5 h (E); a low-magnified image illustrating how many Lipiodol droplets are found, at 1 h (F). (G–I) Rat plasma samples at different time intervals following oral administration by gavage of embedded Lipiodol NCs in MP formulation at 0 (G), 0.5 (H), and 1 h (I). (Scale bars: A–D and F–I, 100 nm; E, 200 nm.)

