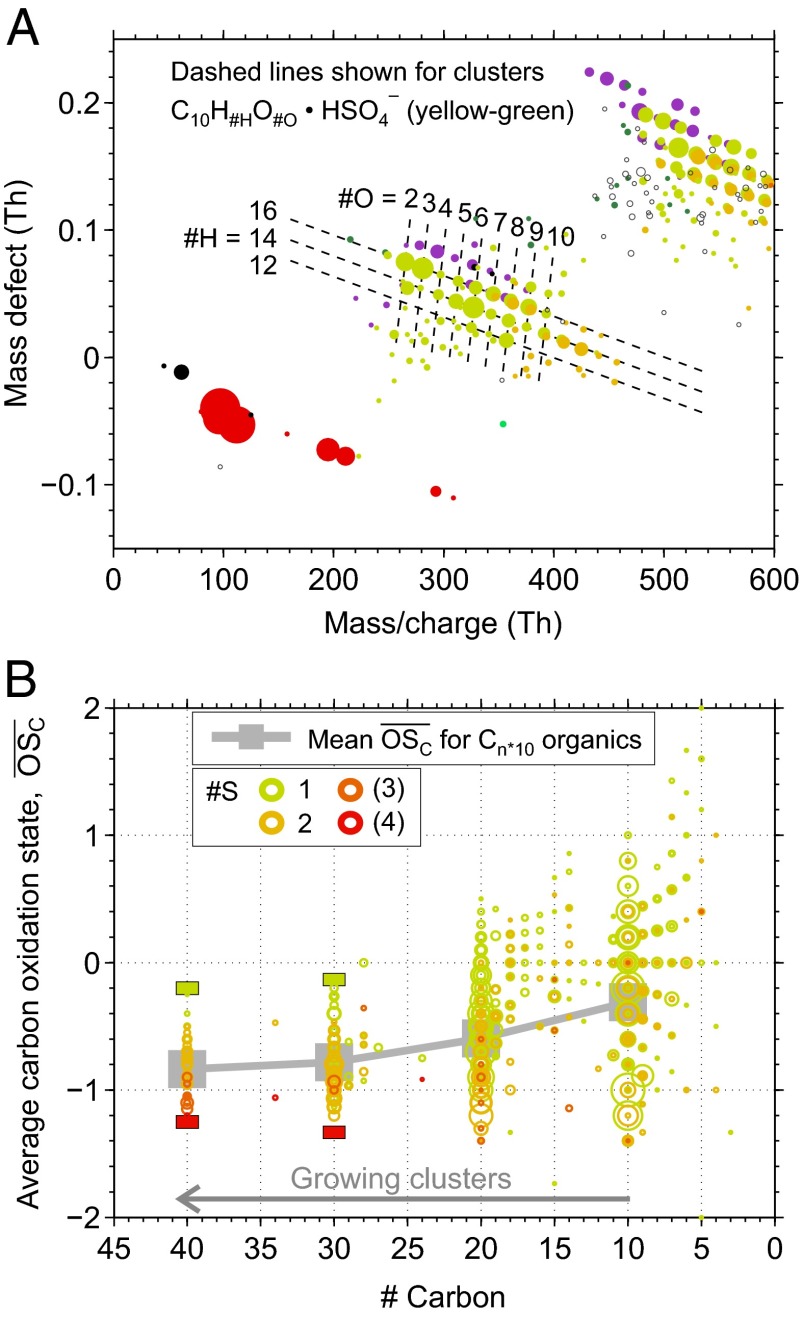
Fig. 2.
(A) Mass defect diagram for a part of an anion mass spectrum during a new particle formation event. The composition of oxidized organic compounds can be identified by the exact ion mass, translating to a certain position in this diagram, as visualized by dashed lines for clusters C10HxOy • HSO4−. Color coding follows Fig. 1. (B)  for oxidized organics (CxHyOz) within clusters of the type CxHyOz • (H2SO4)m • HSO4− (m = 0, 1, …), shown against their carbon atom content. Circle areas are proportional to ion counts; colors denote different numbers of H2SO4 involved. Rectangles at #C = 30 and #C = 40 represent lower and upper limits for the
  of identified ions assuming one H2SO4 has been misidentified with H2O6 and vice versa. Large gray squares in the background mark the mean
  for Cn*10 organics, connected by gray lines to guide the eye.

