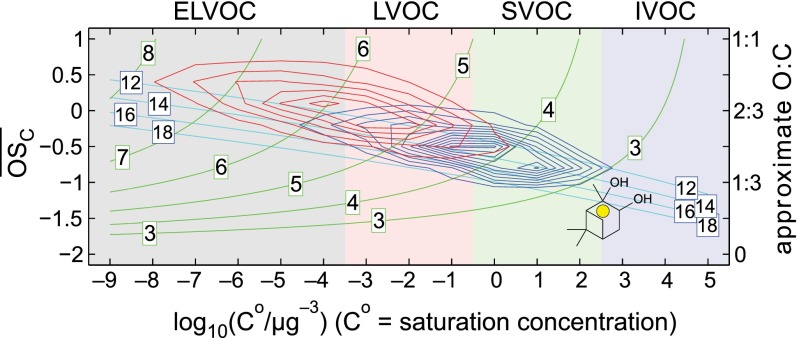
Fig. 3.
Representation of PD oxidation in the 2D volatility basis set. Organics are classified as ELVOCs, LVOCs, semivolatile organic compounds (SVOCs), or intermediate volatility organic compounds (IVOCs). PD is shown with a yellow dot. Isolines are exclusively for C10 compounds, with oxygen number shown with green curves and hydrogen numbers shown with cyan curves. Blue contours show functionalization products predicted for first-generation PD oxidation using the generic OH oxidation kernel; red contours show functionalization products predicted for second-generation products formed from a distribution of first-generation products weighted by the blue contours.

