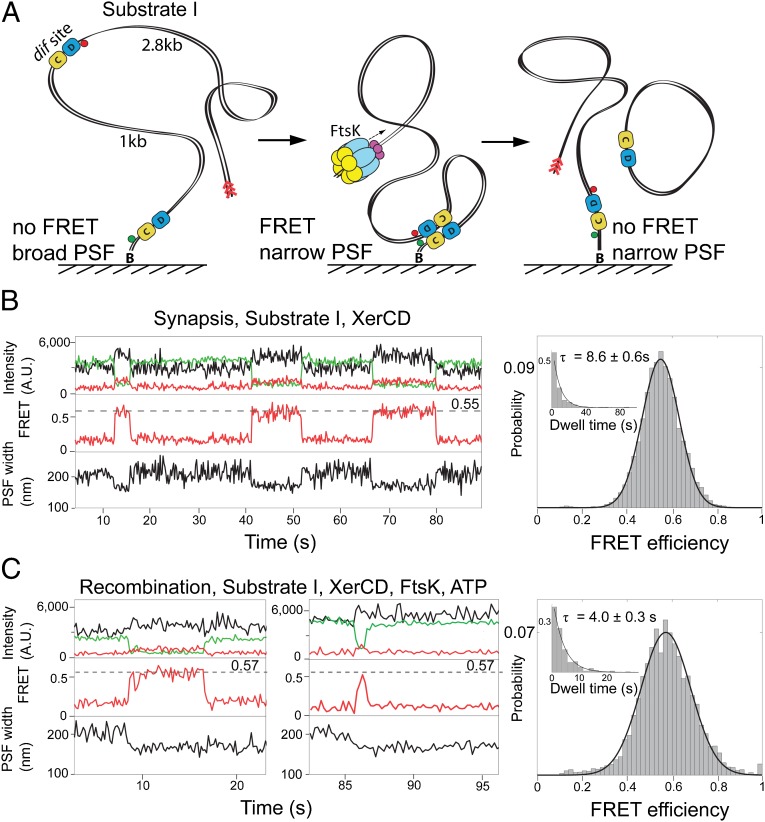
Fig. 2.
XerCD–dif synapsis and recombination. (A) Schematic of the recombination reaction with substrate I. Substrate I has the fluorophores attached to DNA adjacent to each dif site; the positions of the acceptor and the donor fluorophores are indicated with red and green circles, respectively (Fig. S1A). Progression through the recombination was monitored using two observables: PSF width of the acceptor and FRET. Recombination between two dif sites leads to a formation of product DNA molecules, one of them remains attached to the slide and has fluorophores flanking dif on both sides. The preferential binding site for FtsK, KOPS (FtsK orientation polarizing sequence), is indicated with red arrowheads. (B) Nonproductive synaptic complexes (Top). Representative time trace of the intensities of donor (green), and acceptor (red) under donor excitation; and acceptor under acceptor excitation (black). FRET efficiency (Middle) and PSF width (Bottom) are shown. The nonproductive events are defined by the ultimate broadening of the PSF coincident with the disappearance of the FRET signal. All data were acquired at a frame rate of 10 Hz, unless otherwise stated. Histogram (Right) of FRET efficiency (E*) and dwell time (Inset) of XerCD–dif synaptic complexes (n = 380). Dwell times were fit to single exponentials. (C) Recombining complexes. The complexes were identified by the persistence of a low PSF after the disappearance of FRET. Two representative time traces are shown, along with histograms of FRET efficiency and dwell times of recombining complexes (n = 249; Right).

