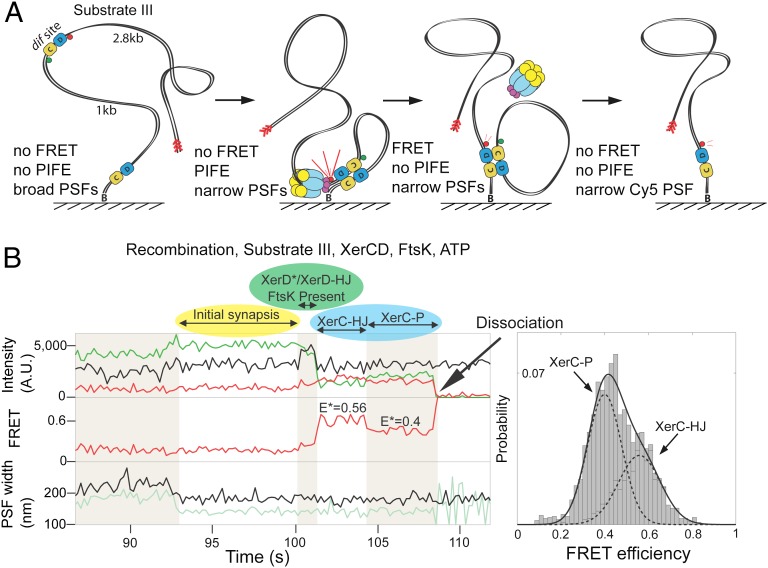
Fig. 4.
Activation by FtsK. (A) Schematic of recombination within substrate III (Fig. S1C). The fluorophores are flanking a distal dif site. On completion of recombination and complex dissociation, the donor fluorophore is lost. Multiple steps during recombination can be distinguished using three observables: PSF, FRET, and PIFE. (B) Representative time trace showing the progression of the recombination with this substrate. The color coding of various states is the same as in Fig. 2C: initial complex, yellow; XerD*/XerD–HJ, green; XerC–HJ/XerC–P, cyan. The increase in acceptor intensity (Top, black line, at ≈100 s), as a consequence of PIFE, is indicative of the presence of FtsK at XerCD–dif and is preceded by simultaneous narrowing of PSFs for both donor (pale green) and acceptor (black), indicative of initial synapse formation. A histogram showing FRET efficiency was fit with two Gaussians (n = 111), having separated the two states using HMM (Materials and Methods). The dwell times for XerC–HJs and XerC–Ps are shown in Fig. S4B.

