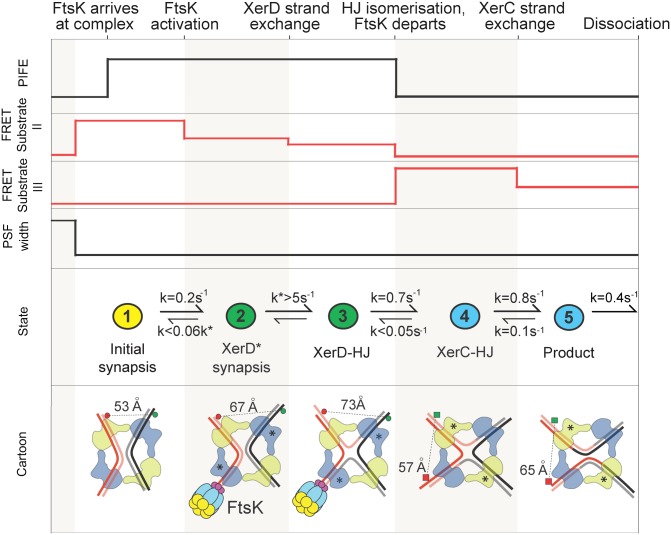
Fig. 5.
FtsK-activated XerCD–dif recombination. (Top and Middle) Summary of the changes in PSF, FRET, and PIFE states of the reactions on substrates II and III, with rate constants deduced from intermediate lifetimes (Materials and Methods). The colors in the Middle correspond to those used in Figs. 2–4. (Bottom) The proposed architectures of the initial, intermediate, and final complexes based on the interfluorophore distances derived from analyses with substrate II (fluorophore pairs indicated with circles) and substrate III (fluorophore pairs indicated with squares). Limits on reverse rates have been estimated given the rarity of backward transitions (2%).

