Figure 6.
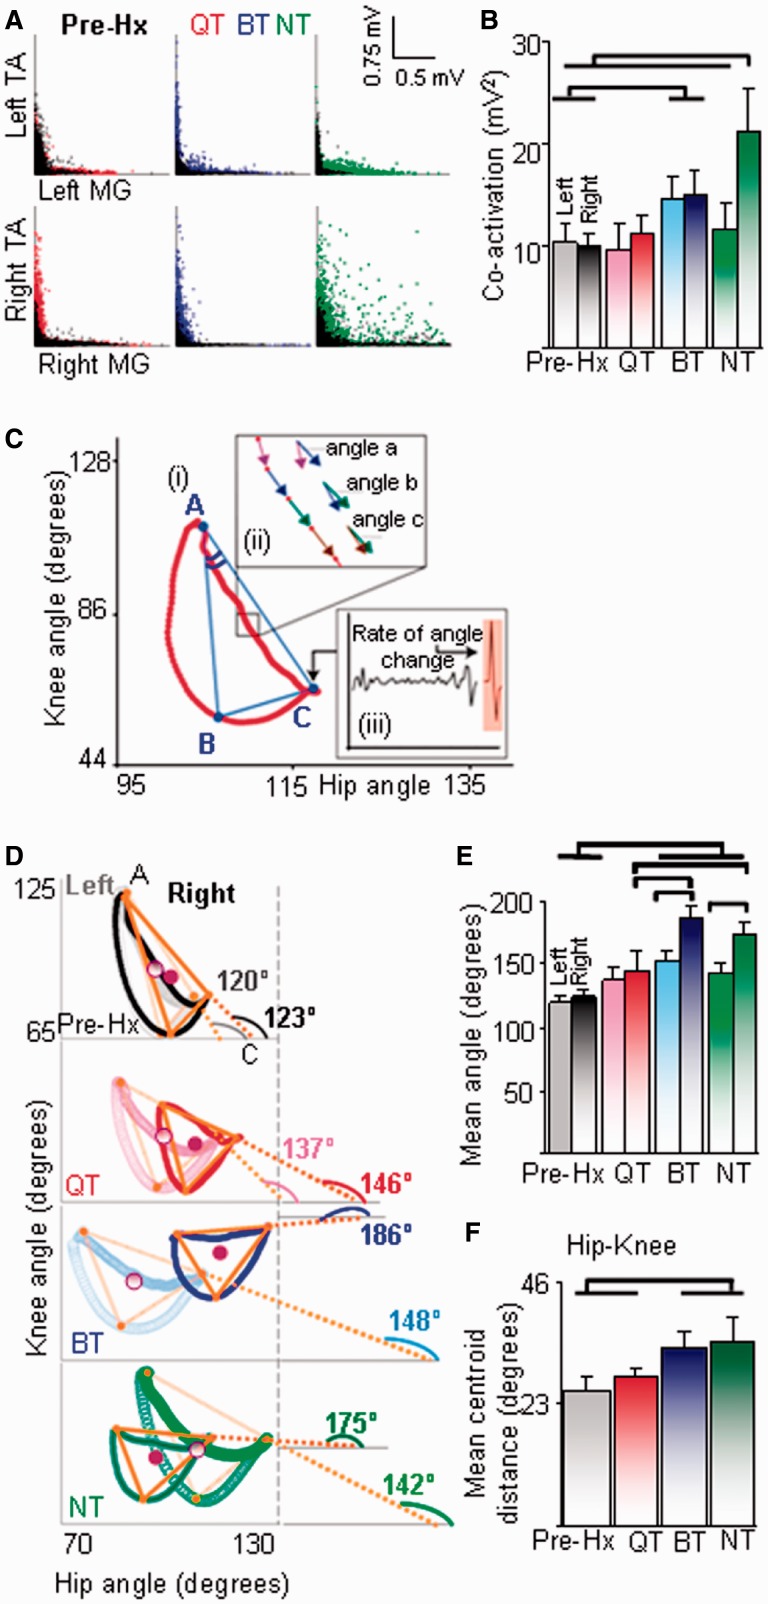
Quadrupedal step-training (QT) improves intralimb coordination and limb symmetry. (A) Joint probability distributions of rectified EMG for the tibialis anterior (TA) and medial gastrocnemius (MG) within each hindlimb during quadrupedal stepping pre-hemisection (Hx) (superimposed black dots) and 21 days (coloured dots) post-hemisection. (B) The levels of tibialis anterior and medial gastrocnemius co-activation within each limb are similar after quadrupedal and bipedal step-training (BT) and highest in the right hindlimb of the non-trained (NT) rats. (C) A triangle is prescribed from the angle-angle plots. Angle A of the trajectory (i) indicates the relationship between the knee and hip joint angles during the transition from swing to stance, segment AC represents this relationship during stance, and segments AB and BC during swing. Angle C of the trajectory represents transition from stance to the swing phase. Angle B of the trajectory represents transition between the initial and middle portions of the swing phase. For both stance and swing, the trajectory is converted into sequential vectors (ii, inset) and the changes in vector-vector angles (example angle b – angle a) that indicate consistency between joint angles in each phase of the step cycle are computed algebraically. An example of the change in angle from the stance to swing phase (rate of change of angle at point C) is indicated by the angle trace (filled orange) in inset (iii). (D) Intralimb coordination determined kinematically via angle-angle plots illustrates the mean right (dark trace) and left (light trace) hindlimb knee-hip angle trajectories from a representative animal in each group. The orange triangle is an algebraic representation of the trajectory shapes as explained in C. The angle of segment AC with the hip joint axis was utilized to indicate the shape of the trajectory. Maximum anti-clockwise rotation of the right hindlimb shape trajectory reflects a change in angular phase relationships between joints within the hindlimb during stepping. (E) Asymmetry between the two hindlimbs is indicated by the differences in the angle prescribed by segment AC with the hip angle axis between the right and left hindlimbs and by (F) greater distances between the centres of trajectories between the right and left hindlimbs (centroid of triangles, maroon circles in D). Values in A, B, E and F are mean (±SEM) for 10 steps from all animals per group and the horizontal lines above the bars indicate significant differences between and among groups (P < 0.05).

