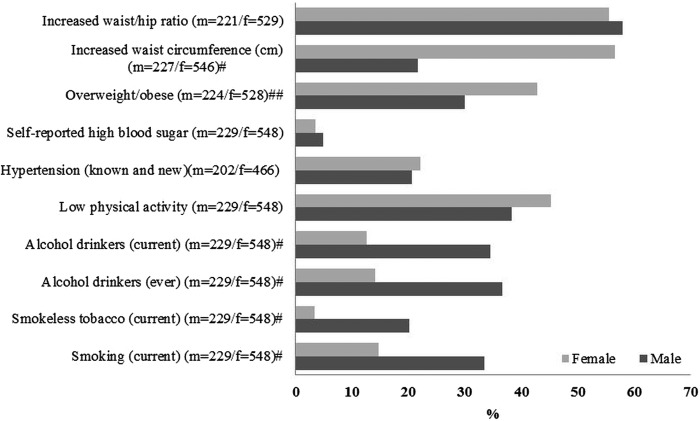
Figure 1.
Sex-wise distribution of cardiovascular risk factor status in the study population. m, Number of males; f, number of females; # p<0.001, ## p<0.01 (χ2 tests). Risk factor categories were based on the WHO-NCD Risk Factor STEPS Survey manual.23 Current smokers included those who responded ‘yes’ to ‘Do you smoke?’ Past smokers included those who replied ‘yes’ to ‘Did you ever smoke in the past?’. ‘Ever drinkers’ included respondents who had ‘consumed a drink that contained alcohol ever in lifetime,’ and current drinkers included respondents who had ‘consumed alcohol within the previous month.’ The percentage of drinking frequency represents current drinkers who consumed at least one standard drink per occasion. Blood pressure data exclude respondents who did not submit to all three readings. Likewise, data for BMI, waist circumference and waist-hip ratio exclude respondents whose weight, height and waist and/or hip measurements were not taken. Increased waist circumference includes waist measurements of ≥80 cm (women) and ≥90 cm (men); increased waist–hip ratio is ≥0.85 (women) and ≥0.90 (men).

