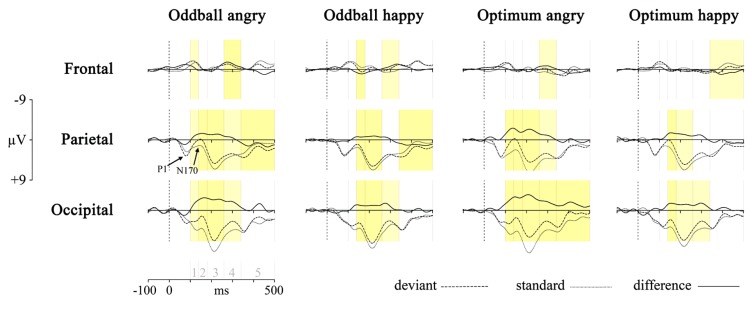
FIGURE 2.
Processing of deviant angry or happy stimulus in the oddball (two left panels) and optimum (two right panels) experiment as compared to processing of the same stimulus as standard in the other experimental session. The dotted line is the averaged activity when processing of the standard, the broken line is for the deviant and the solid line is the difference wave (vMMN, deviant – standard). Graphs represent results from three pooled sites (frontal, parietal, and occipital). Shaded areas represent the difference between processing of deviant and standard: darker yellow is for full-interval difference and lighter yellow is for the significant difference between deviant and standard within more than half of the interval. Intervals under comparison are marked in the scale in the lower left corner: 1 – 100–140 ms, 2 – 140–180 ms, 3 – 180–260 ms, 4 – 260–340 ms, and 5 – 340–500 ms.

