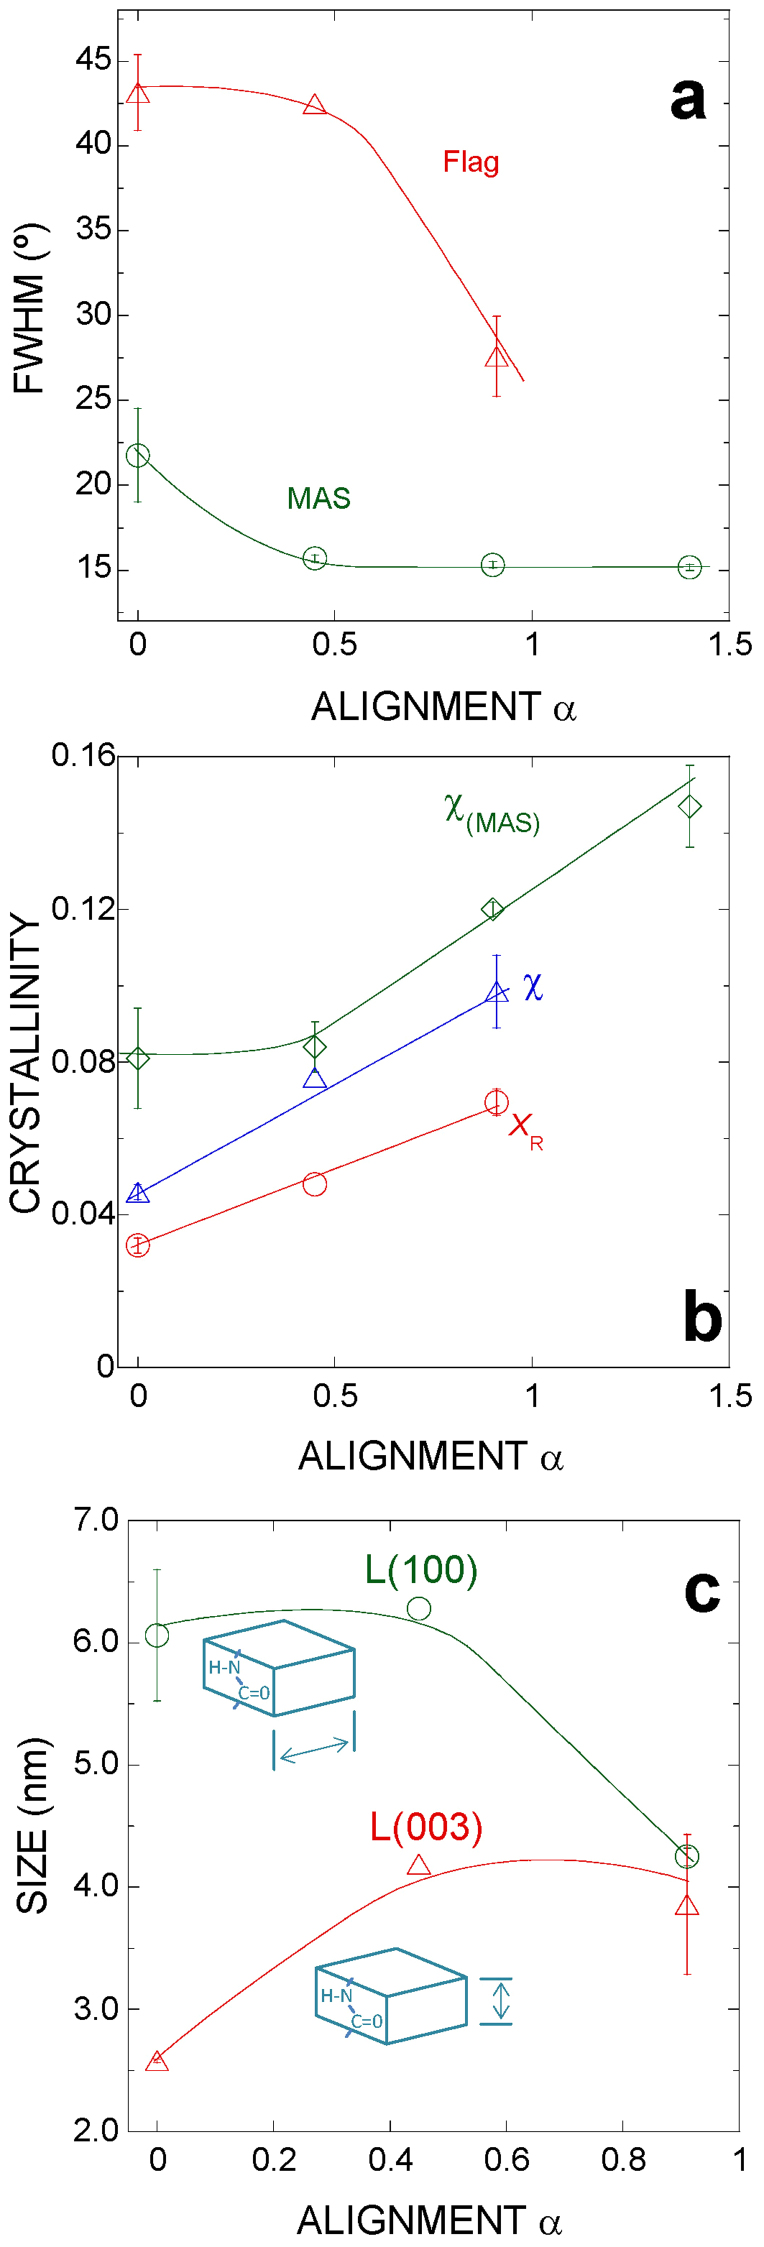
Figure 3. Variation of the nanocrystal parameters with different values of α.
(a) Orientation of the nanocrystals as measured from the FWHM of the gaussian used to fit the azimuthal profile of the equatorial Bragg peak (100). Corresponding values in MAS are included to facilitate comparison. Error bars represent standard error. (b) Variation of crystallinity as measured by (i) XR, ratio between the intensity of the (100) peak and the total intensity of a nearby section, and (ii) χ, ratio between the intensity of Bragg peaks and total intensity20. Data corresponding to MAS are shown for comparison. (c) Variation of the size of the nanocrystals in Flag along two perpendicular directions, (100) and (003), as calculated from the Scherrer's equation.

