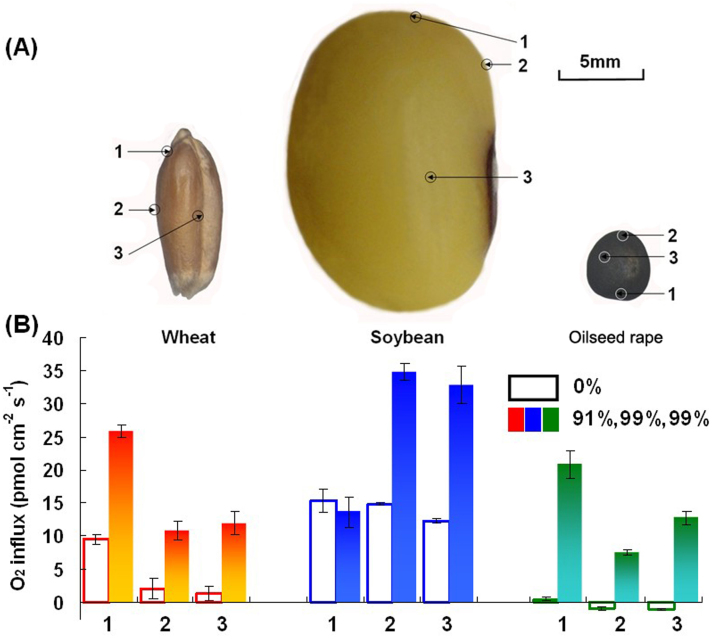
Figure 1. Detection sites of seeds and oxygen fluxes in wheat, soybean, and oilseed rape.
(A) Three seeds and detect sites. For wheat seed, site1, site2 and site3 represents the center of the embryo, the center of side with embryo of the whole seed, and the center of the ventral groove, respectively. For soybean seeds, the sites were located at the top of the embryonic axis (site1), the centre of the embryonic axis (site2), and the centre of one cotyledon (site3). For oilseed rape, site1, site2 and site3 represents the center of the embryonic axis, the opposite side of the embryonic axis, and the center of one of the cotyledons, respectively. The bar represent is 5 mm. (B) Oxygen influx at different sites of wheat seeds (red) with 91% and 0% viability, soybean seeds (blue) with 99% and 0% viability, and oilseed rape (green) with 99% and 0% viability. Positive value indicates oxygen influx. Bars represent standard errors.

