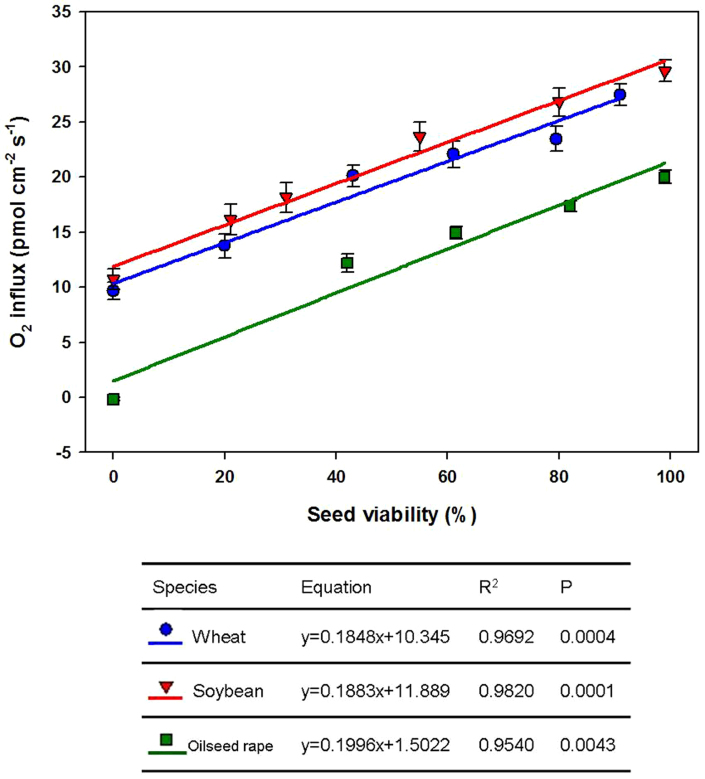
Figure 3. Correlation between seed viability and oxygen influx in wheat (red line), soybean (blue line), and oilseed rape (green line).
Values are the means of 20 to 30 replicates, and bars represent standard errors. The table describes the linear equations between seed viability and oxygen influxes.

