
Figure 1.
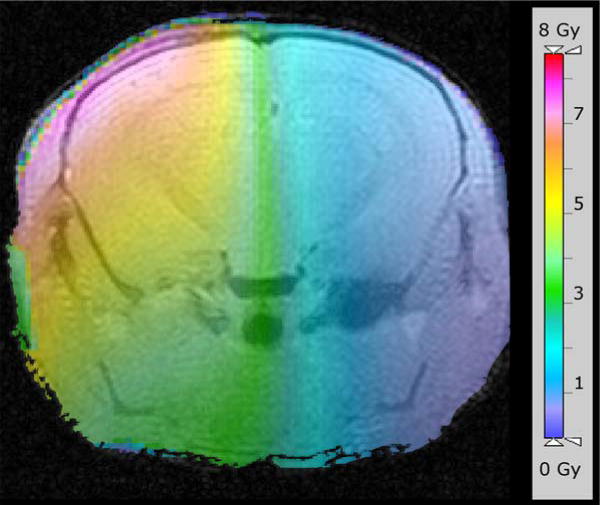
Radiation plan, shown as a color map overlaid onto a representative MR image of mouse brain. The scale bar on the right indicates the radiation dose delivered to the brain. Irradiation is limited effectively to the left hemisphere of the brain, with the highest dose delivered at the brain’s surface.