
Figure 5.
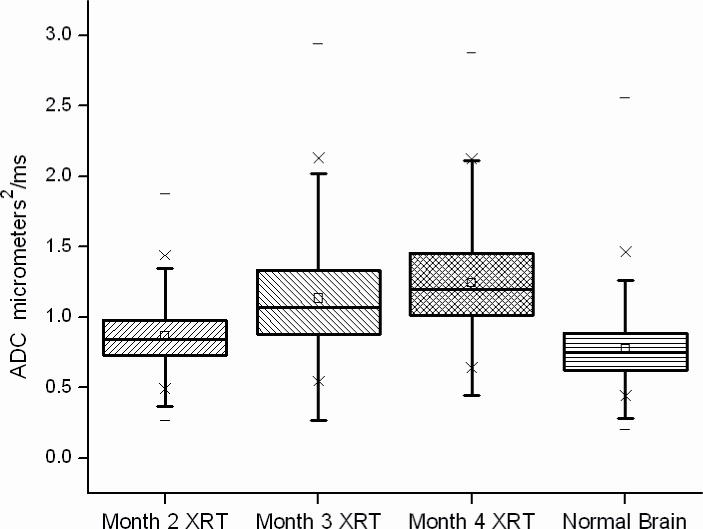
Box and whisker plot of the ADC values in regions of interest drawn around areas of abnormal signal on b=0 anatomic images and corresponding contralateral untreated brain tissue for all irradiated animals studied. The 25th–75th percentiles are blocked by the box, and the whiskers identify the 99th percentile of the range of diffusivity (ADC) values for each tissue type. A progressive increase in diffusivity is seen that correlates with the progressive tissue damage identified with MR imaging and histology at each time point. There is a statistically significant difference in ADC values between radiated brain tissue and normal brain (p<0.001) at each time point.