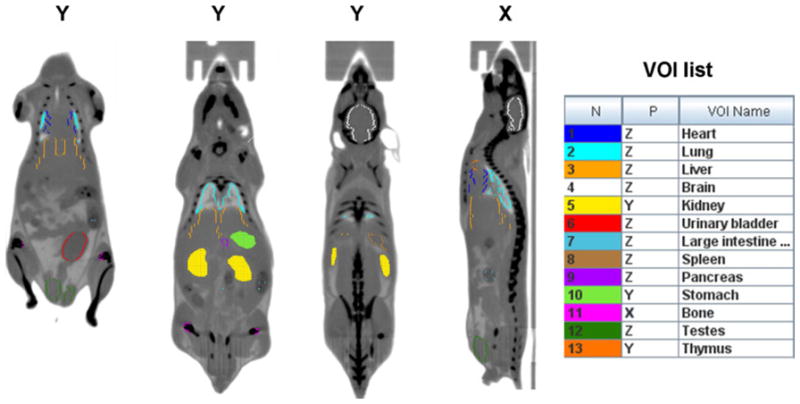
Fig. 1.

Representative mouse CT images in coronal (Y) and sagital (X) views showing the drawing of volume of interest (VOIs) on different organs. The CT images were acquired at two overlapping bed positions. The VOIs drawn in the same view as the one shown appear as filled contours, while the ones drawn in different view appear as colored contours. The complete list of VOIs is shown on the right handside.
