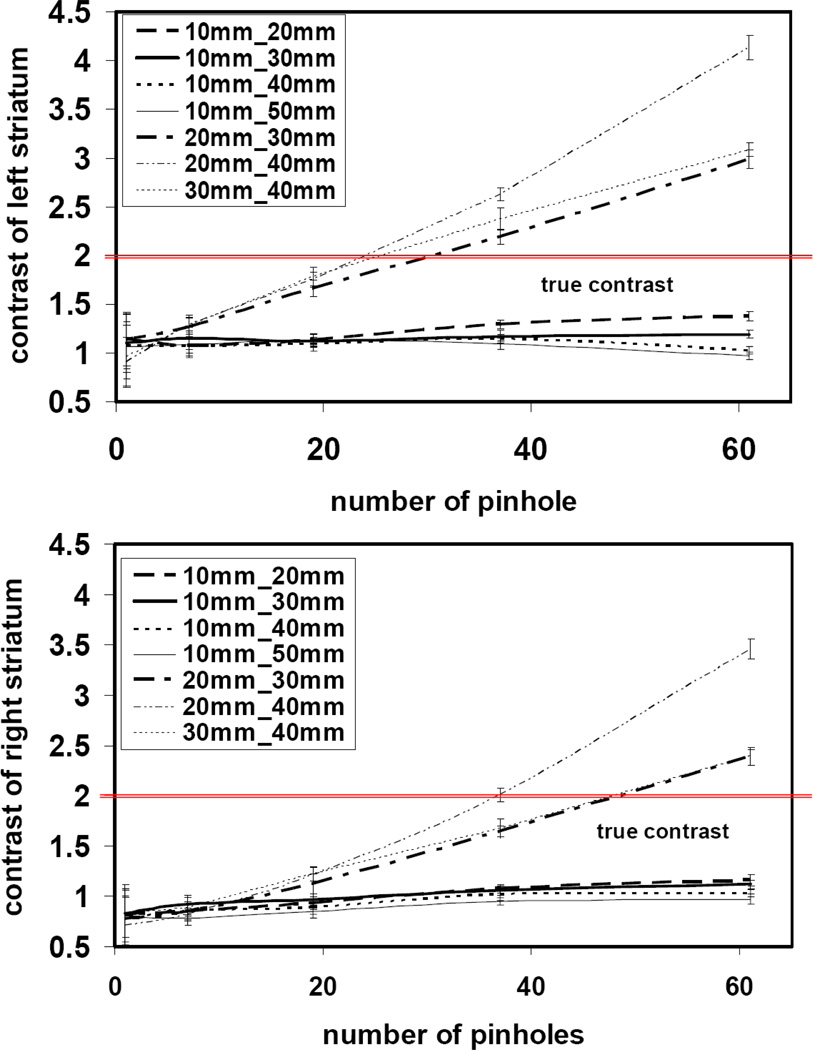
Figure 11.
Mean contrast of the left (top figure) and right (bottom figure) striatum of the mouse brain phantom. Images were reconstructed with variable combinations of front and back detector distances and number of pinholes. For each geometric configuration, an ensemble of 20 noisy projection data was generated and reconstructed. The error bars represent the standard deviation of the contrast across this ensemble. The horizontal lines indicate the true contrast at 2. The true anatomical size of the striata (figure 3) was used for the contrast measurements. The underestimates of the contrast seen in configurations (10–20, 10–30, 10–40, 10–50) are primarily attributed to partial volume effects, while the overestimates arise from artifacts related to the projection multiplexing in configurations with high magnification on both detectors and higher numbers of pinholes.

