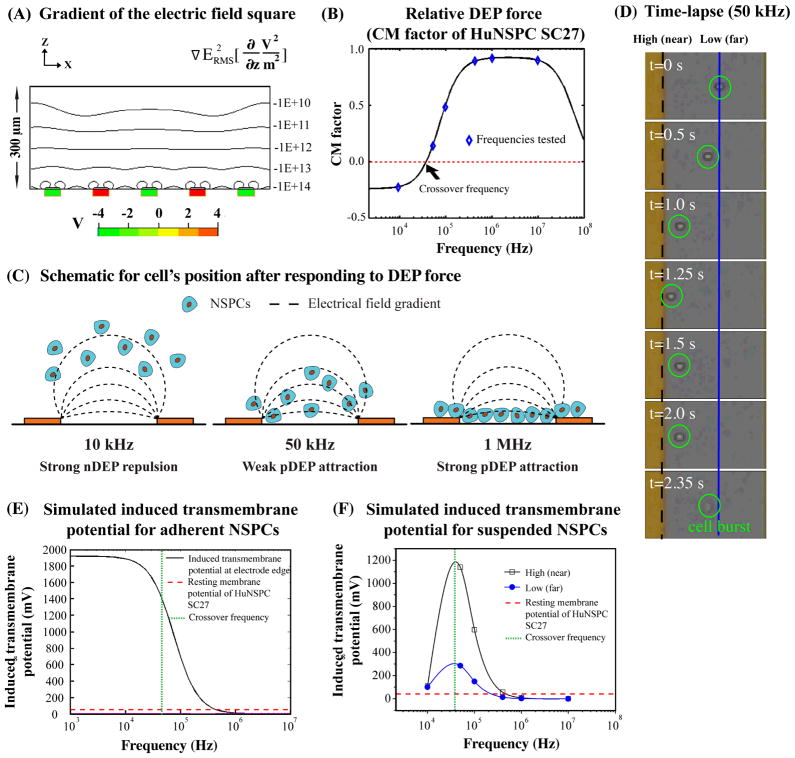
Fig. 6. Rapid increases in the transmembrane potential of cells at frequencies slightly above the crossover frequency cause membrane disruption of NSPCs in suspension.
(A) The iso-curves represent the root mean square of the gradient of the electric field square in the z direction (see equation above graph). The induced DEP force is proportional to the iso-curve value. The red and green boxes represent electrodes with either positive or negative applied voltages. (B) Graph shows the simulated CM factor (parameters in Table S1 in Supporting Material) of HuNSPCs (SC27) at various frequencies. The blue diamonds represent the CM factor of SC27 cells at frequencies used in the current study to test the toxicity of DEP exposure to cells. The derived crossover frequency of SC27 cells is 45 kHz (red dashed line). (C) Schematic represents cells’ final positions relative to electrodes at various applied frequencies. (D) Time lapse images show behavior of a cell (circled in green) in response to 50 kHz DEP frequency over ~2.4 sec. The dashed black line represents the edge of the electrode (high electric field) while the solid blue line denotes the position of cells that have moved away from the electrode (lower electric field). (E) The graph shows the induced transmembrane potential of a hypothetical population of adherent SC27 cells at the edge of electrodes. The lower the frequency applied, the higher the induced transmembrane potential of NSPCs. The red dashed line represents the resting membrane potential of SC27 HuNSPCs, 51.6+/−2.6 mV, n=20. The green dashed line represents the crossover frequency of SC27 cells (~45 kHz). The parameters for the modeling are listed in Table S1 in Supporting Material. (F) The graph depicts the frequency-dependent induced transmembrane potential of suspended SC27 cells accounting for the final position of the cells relative to the electrode (and thus the strength of the electric field). The black line denotes the induced transmembrane potential for cells in a region of high electric field near the electrodes, as shown by the black dashed line in D, and the blue line denotes the induced transmembrane potential for cells in a region of low electric field farther from the electrodes, as shown by the blue line in D. The parameters for the modeling are listed in Table S1 in Supporting Material.

