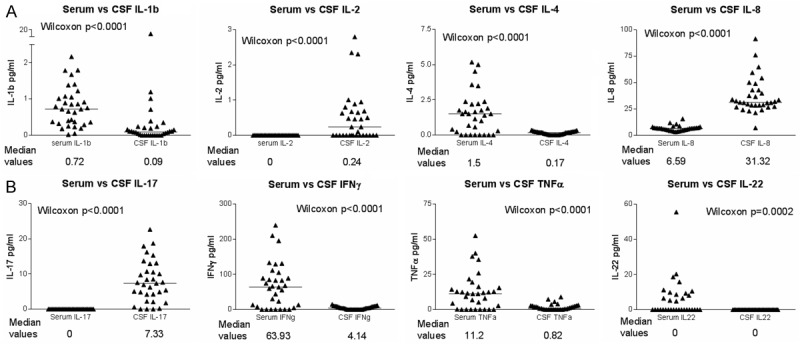
Figure 2.

Differences between serum and CSF cytokines; horizontal bars denote median values. Y axes give cytokine concentrations in pg/ml. Comparison of serum/CSF cytokines are paired (i.e. CSF and serum from the same patient). Graph shows all subjects who had both serum and CSF available for analysis (i.e. a mix of diagnostic groups).
