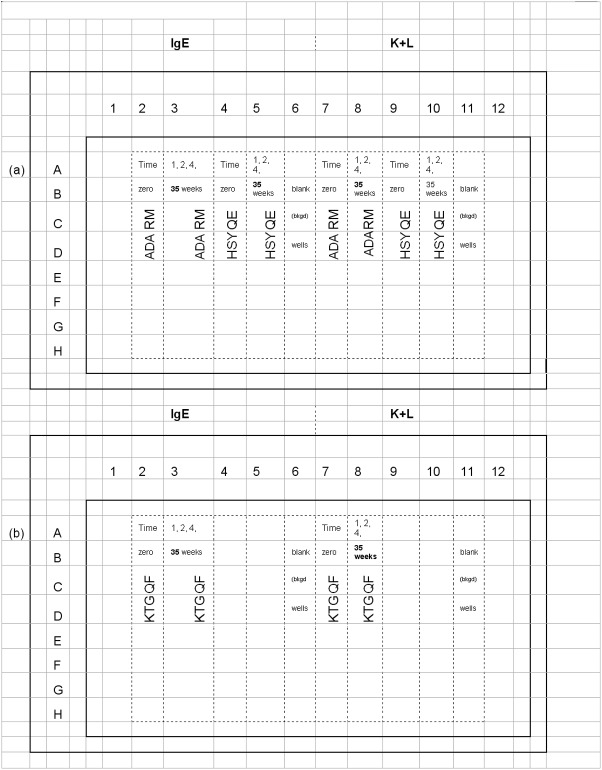
Figure 5.
Microplate maps employed in measuring epitope-specific IgE/(lambda + kappa) levels are displayed: Plate map 5a shows the peptide-specific well set positions used to measure date-relevant ADARM and HSYQE-specific IgE/(kappa + lambda) ratio values. Plate map 5b displays plate layout used in measuring date-relevant KTGQF-specific IgE/(kappa + lambda) ratio values.

