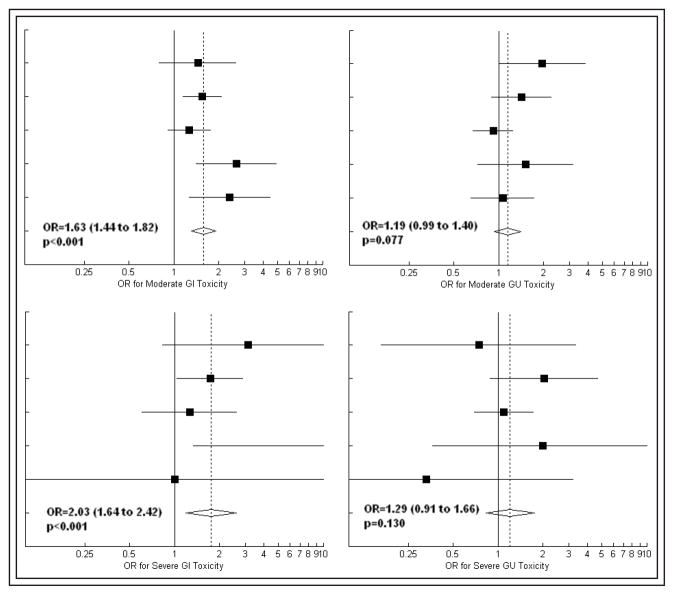
Figure 2.
Forest plots depicting the effect of dose escalation on late toxicity in five randomized trials (Beckendorf et al, Dearnaley et al, Peeters et al, Pollack et al, and Zeitman et al, from top to bottom). Area of solid squares is proportional to sample size. Extent of diamond represents the 95% confidence interval for the pooled estimate of effect size.
OR = odds ratio, GI = gastrointestinal, GU = genitourinary.

