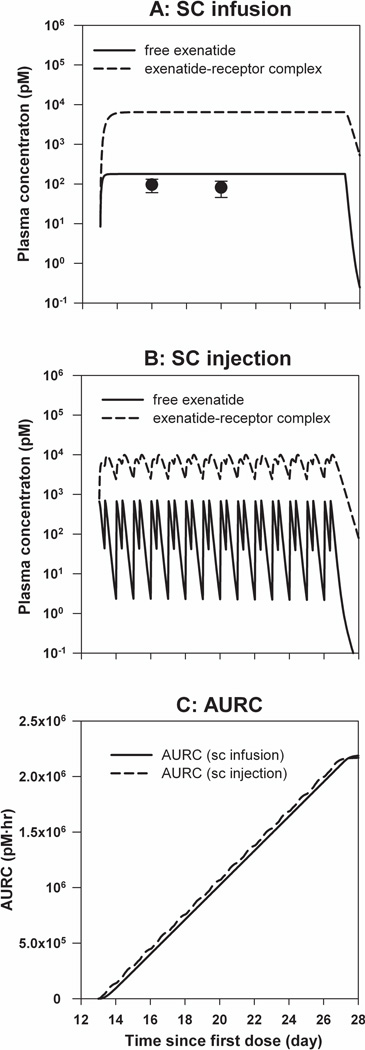
Figure 3.
Simulated pharmacokinetic profiles of exenatide. A) Free exenatide and drug-receptor complex profiles following continuous SC infusion (20 µg/kg/day). Symbols are mean measured concentrations (±SD), and lines are model-predicted profiles. B) Free exenatide and drug-receptor complex profiles following multiple SC injections (10 µg/kg twice daily). C) Cumulative AURC during 2-week exenatide therapy. Solid line is simulation of AURC following continuous SC infusion and dashed line is simulated AURC following multiple SC injections.

