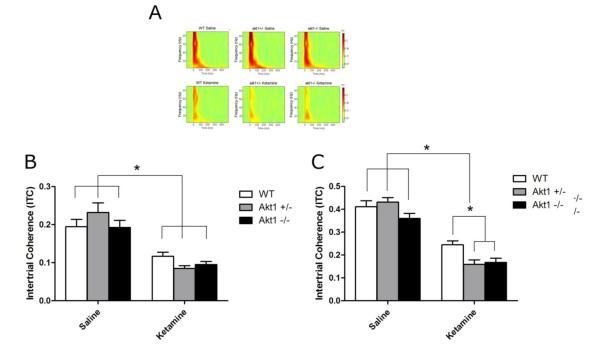
Fig 5.
Intertrial Coherence (ITC) in WT, Akt1+/− and Akt1−/− mice. Figure A Top shows ITC heat map following saline while Figure A bottom shows ITC heat map following 50 mg/kg ketamine. B. ITC for the theta frequency band was significantly reduced following ketamine treatment, but this did not differ as a function of genotype (p<0.05). C. A significant decrease in gamma power was observed following ketamine administration. Both Akt1+/− and Akt1−/− mice showed significantly reduced gamma ITC in response to ketamine relative to WT mice. Asterisk denotes significance at p<0.05

