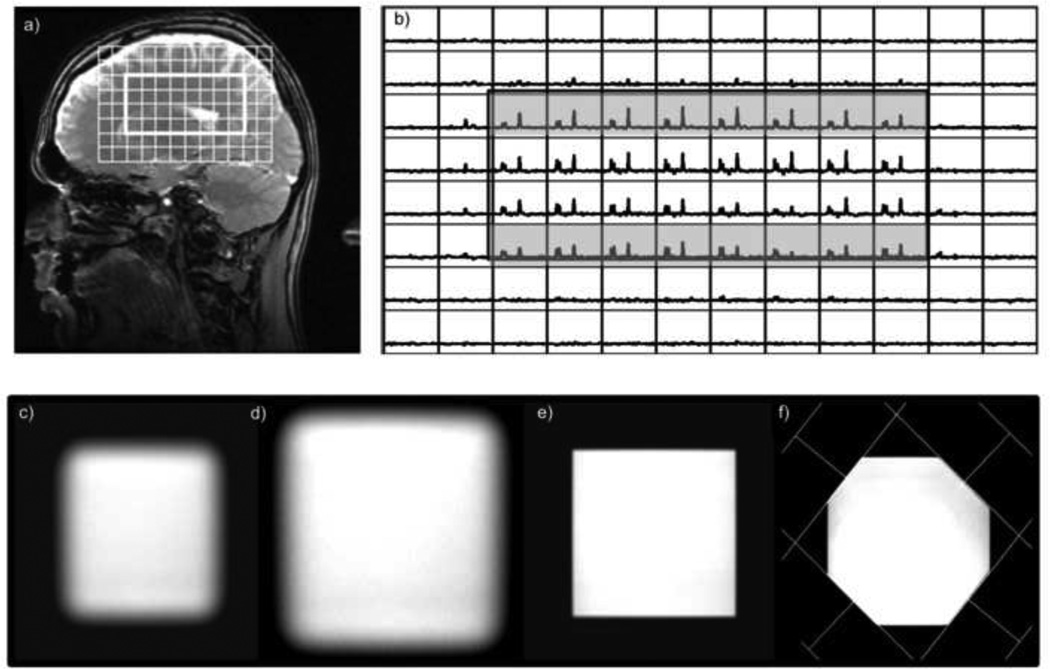
Figure 1.
Demonstration of the impact of the chemical shift artifact for 3D PRESS 1H MRSI volume selection acquired with the product sequence with a 180 degree pulse bandwidth of 936Hz: a) image showing the location of the volume and b) the corresponding spectral array (b) The chemical shift artifact is clearly seen on the top and bottom slices from the sagittal orientation. The lower row of images show c) the cross-section of a selected volume, the same volume obtained with OVERPRESS =1.2 d) without OVS, e) OVS bands that sharpen the edges and f) with additional graphically prescribed OVS bands that conform the volume to an octagon.

