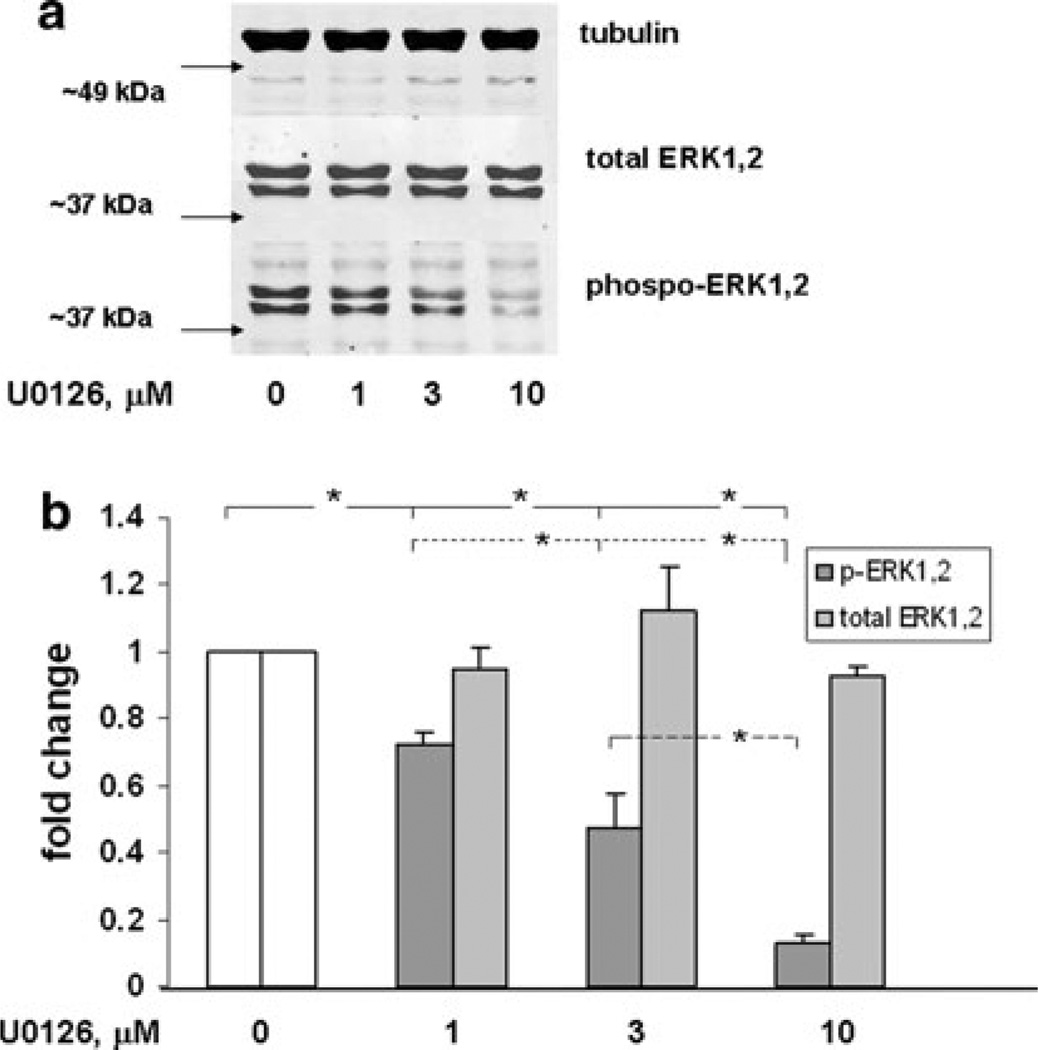
Fig. 5.
Dose response of ERK1,2 protein expression and phosphorylation in ST88-14 cells triated with U0126. a ST88-14 cells were treated with U0126 at the concentrations indicated for 16 h. Samples were analyzed by western blot and probed for the indicated protein. After each probe, the blot was stripped and reprobed for the subsequent protein. Data shown are representative of three independent experiments. b The bar graph quantitatively illustrates the means ± SEM for the three experiments described in a. Phoshorylated(p)-ERK1,2 expression was significantly less (* P value < 0.05) with each increase in U0126 concentration. Total ERK1,2 does not change throughout treatments

