
Figure 2. Establishment of STZ-induced Diabetes in Nrf2 mouse model; Nrf2 influences slow muscle fiber pathways.
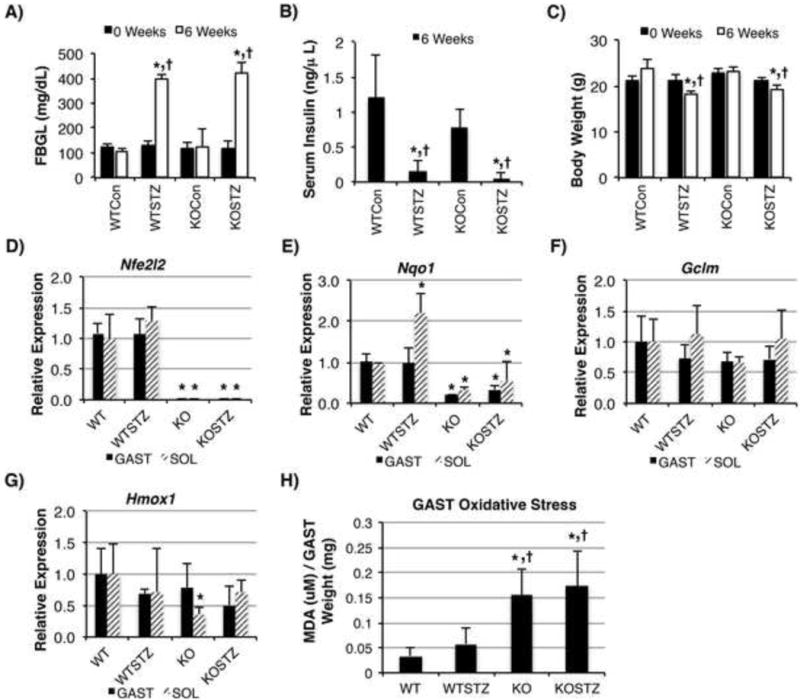
Nrf2 WT or KO mice were given STZ to induce diabetes. Fasting blood glucose levels (FBGL) (A)), serum insulin levels (B) and total body weight (C) illustrate both WT and KO mice establish diabetes. Relative mRNA expression levels (setting WT control to 1) are displayed for Nfe2l2 (Nrf2) (D)), Nqo1 (E), Gclm (F) and Hmox-1 (HO-1) (G)). Oxidative stress (H) was analyzed by TBARS assay. For A-C, * = p < 0.05 compared to WT control, † = p < 0.05 compared to KO control; N=4-6 animals/group. For D-G, * = denotes fold change greater than 2-fold compared to WT control; N=3-6 animals/group. For H, * = p < 0.05 compared to WT control, † = p < 0.05 compared to WT+STZ; N=4 animal/group.