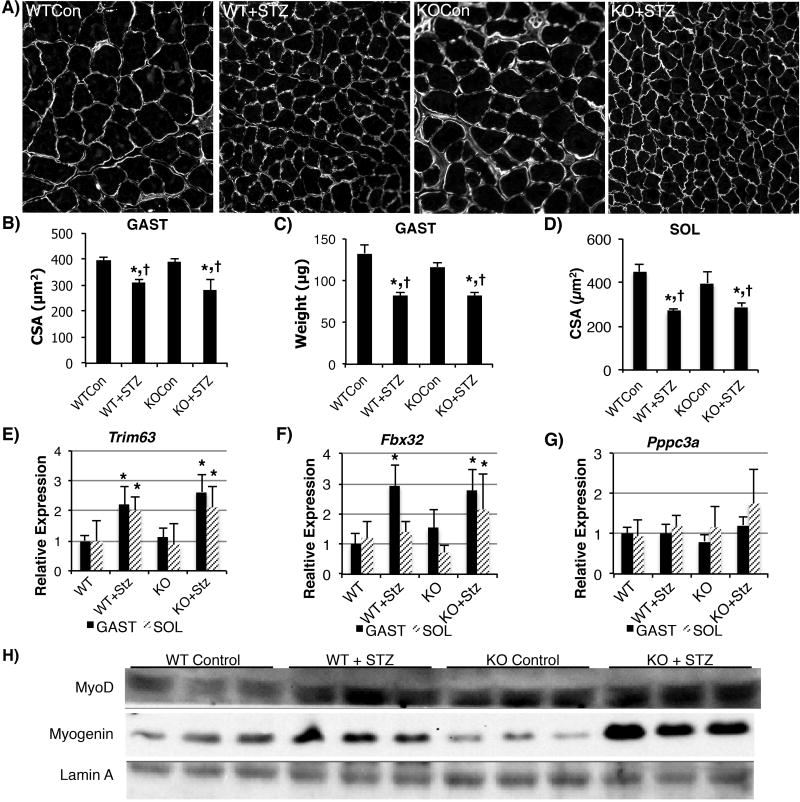
Figure 3. Diabetic muscle atrophy is not dramatically affected by Nrf2 status.
Representative images (A) of Gastrocnemius muscle (GAST) stained with dystrophin to mark the membranes, which were used to determine muscle cross sectional area (CSA). Average GAST CSA for each animal group (B) (Average ∼2,500 fibers/animal). Dry GAST muscle weight (C) shows trend toward reduction in KO control and significant reduction in WT+STZ and KO+STZ. Total CSA from Soleus (SOL) (D) show similar decrease in muscle size to GAST. Relative mRNA expression of proteolytic genes Trim63 (Murf1) (E), Fbx32 (Atrogin-1) (F) and Ppp3ca (Calcineurin-A) from GAST and SOL muscles. Representative Western blots (H) for MyoD and Myogenin from animal SOL samples illustrate an increase in MyoD expression in WT+STZ, KO control and KO+STZ. Lamin A was used as a loading control. For B-D, * = p < 0.05 compared to WT control, † = p < 0.05 compared to KO control; N=4-6 animals/group. For E-G, * = denotes fold change greater than 2-fold compared to WT control; N=3-6 animals/group.

