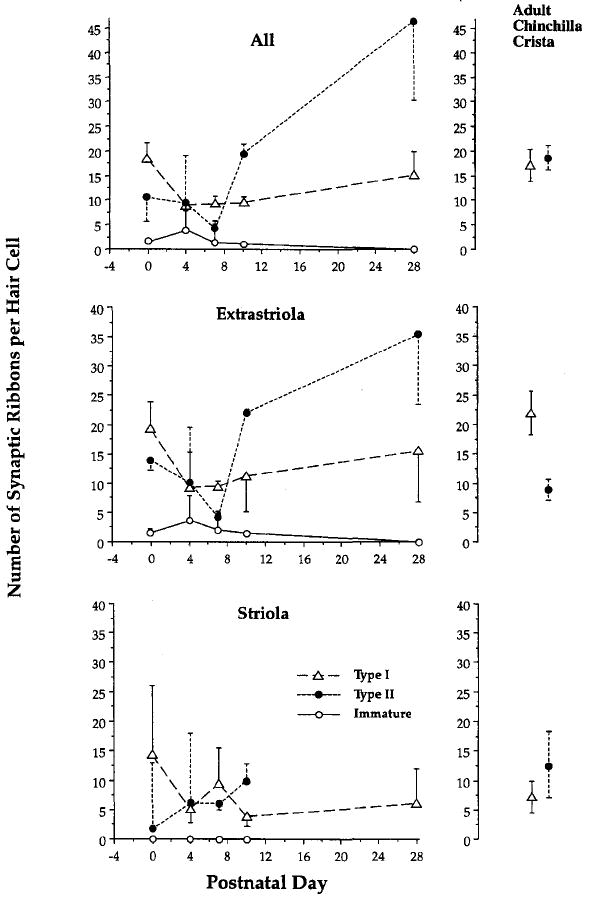
FIGURE 1.

Development of synaptic innervation over the first postnatal month in mouse utricle. The key for the entire figure is given in the bottom (striola) panel. Values for adult chinchilla crista are shown at right; they are taken from reference 6 and represent all (top), the peripheral zone, equivalent to the extrastriola (center); and the central zone, equivalent to the striola (bottom).
