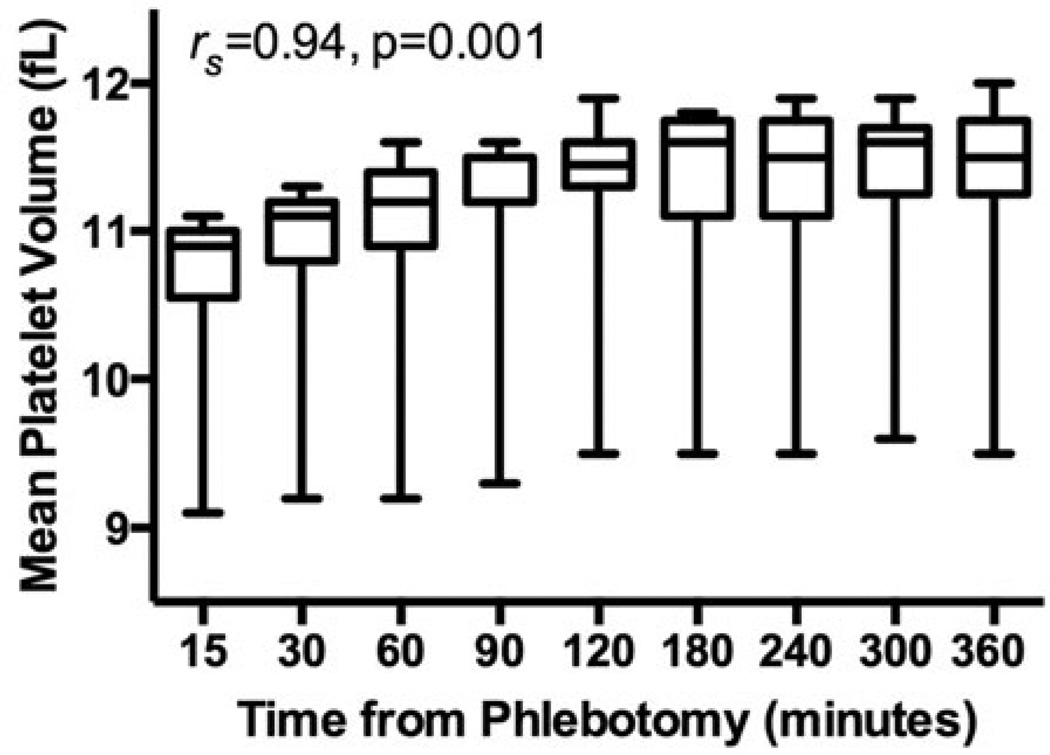
Figure 2.
Effect of time between phlebotomy and MPV measurements. MPV was assessed in healthy volunteers (n=10) at nine different time points from the time of phlebotomy. Correlation is shown between time from phlebotomy and average MPV levels using Spearman’s test. Data presented as median [interquartile range] (box) and range (whiskers).

