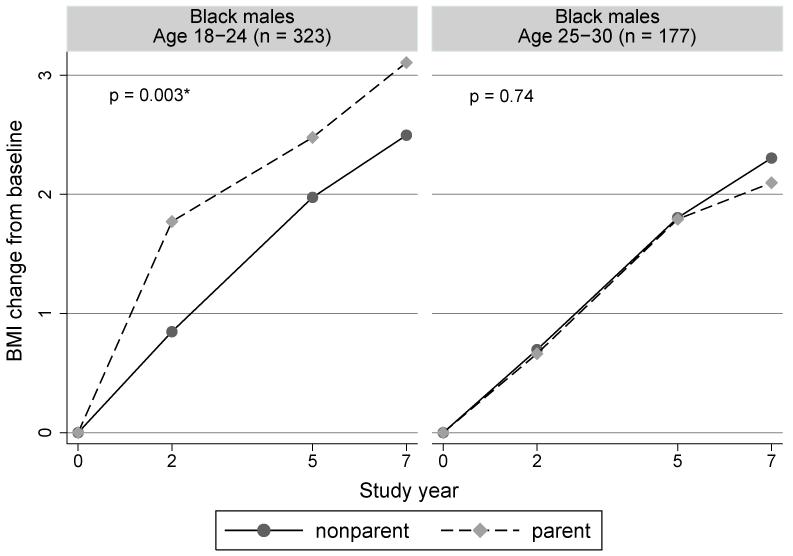
Figure 1.
Adjusted average change in BMI from baseline at each time point for parents and nonparents.
n is the number of subjects.
* p < 0.0125.
Data points are the estimated BMI changes from baseline, adjusted for baseline covariates.
These were computed using the LSMEANS statement in SAS. The points of value zero at year 0 are added only for illustrating the change from baseline for the other visits.
The p-value is for testing if the adjusted BMI change from baseline, averaged across the 2-, 5-, and 7-year time points, differs between the parent and nonparent groups
Note participants change groups as they have children.

