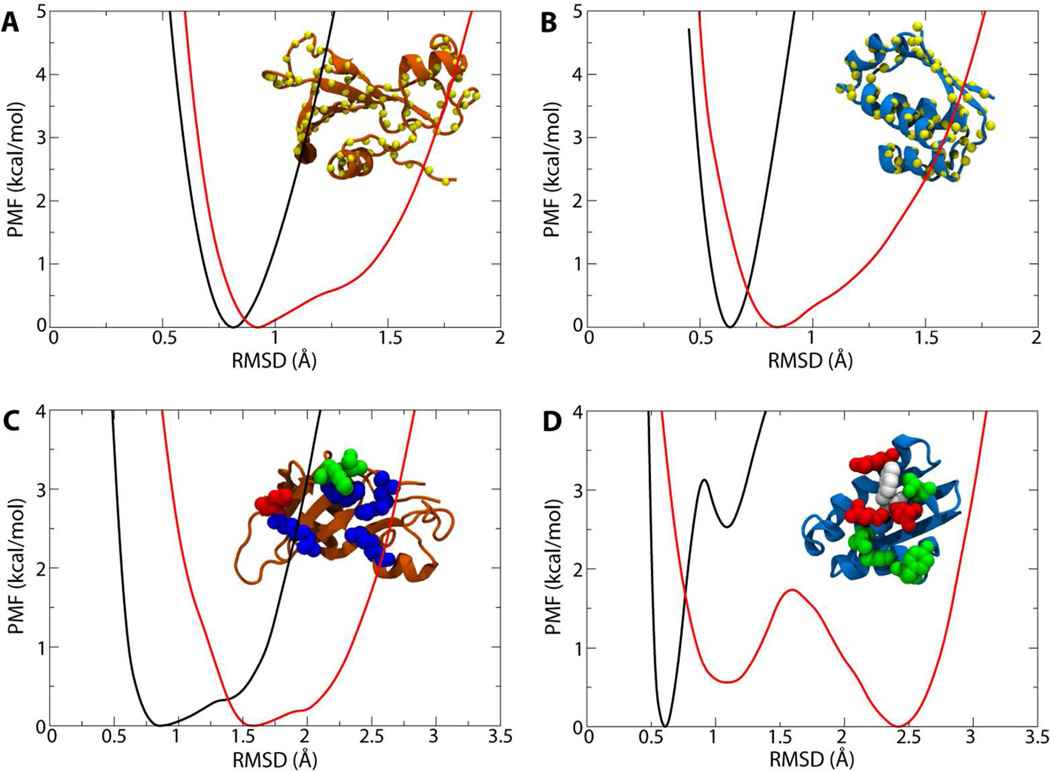
Figure 3.
PMFs for the eight conformational restraints on the proteins’ RMSD. In each panel, the black curve is the PMF for the bound state, the red curve is the PMF for the bulk state of the protein, and the inset figure displays the affected atoms as spheres. (A,B) PMFs for restraints on the conformation of (A) barnase and (B) barstar. (C,D) PMFs for restraints on selected interfacial residues in (C) barnase and (D) barstar. Restrained residues are colored as in Figure 1B.

