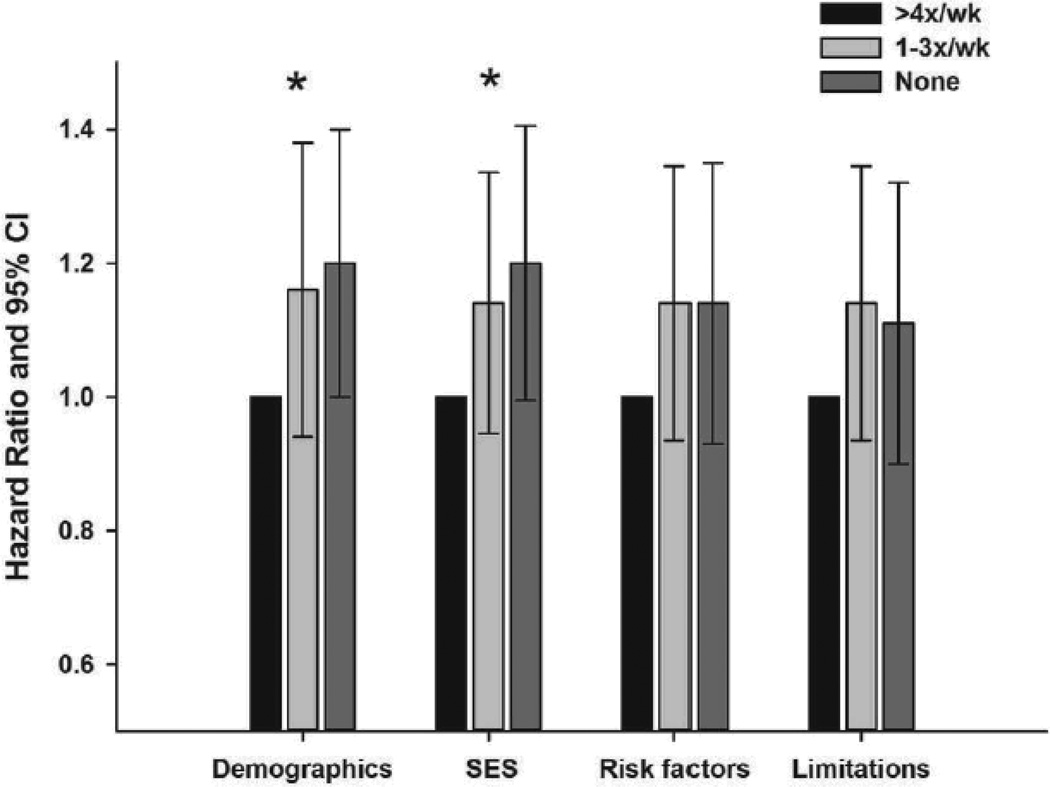
Figure 1.
PA frequency and risk of incident stroke/TIA. The initial regression model included adjustment for demographics (age, sex, race and age-race interaction) and then further adjustments were performed for 3 additional models: SES (including region, urban/rural residence); stroke risk factors (diabetes, hypertension, BMI, alcohol use, smoking); presence of physical limitations (unable to climb stairs, perform moderate physical activities). * denotes significant association between PA and stroke (Ptrend < 0.05).

