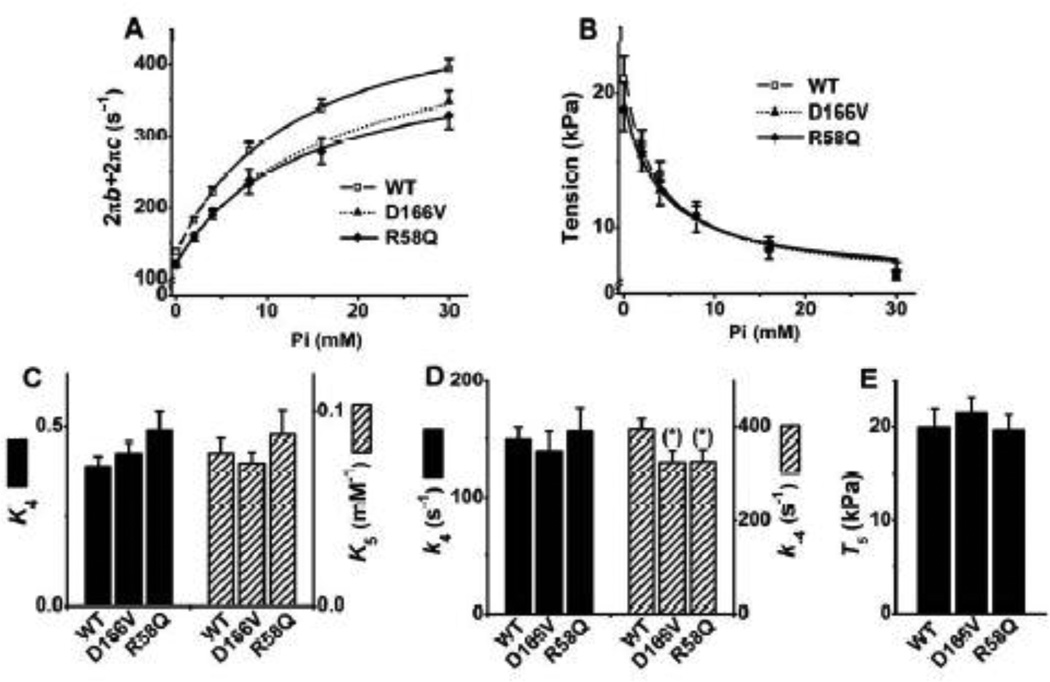
Fig. 6.
(A) Plots of 2πb+2πc (2πb: rate constant of process B, the delayed tension), (B) isometric tension, (C) equilibrium constants of steps 4 (Force generation) and 5 (Pi release), (D) the rate constants of step 4, and (E) tension generated by strongly attached cross-bridges (T5) in the Pi study. The curves in (A) represent Eq. 4, and the curves in (B) represent Eq. 5 with best-fit parameters. WT, n = 26; D166V, n = 16; R58Q, n = 21.

