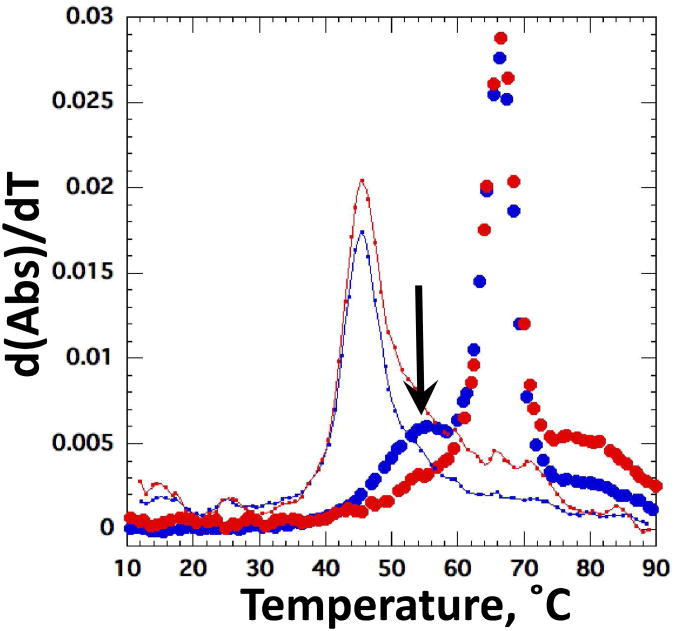
Figure 5.
Melting profile of the M-box riboswitch. Data are plotted as the derivative of absorbance with respect to temperature at 260 nm (blue) and 280 nm (red). Closed circles correspond to data collected in buffer with 50 mM K+, 1 mM putrescine2+ and 1 mM Mg2+, in K•MOPS – EDTA buffer. Solid lines correspond to data collected in the same buffer with 50 mM K+ and no divalent ions. Arrow indicates new transition that appears in the presence of Mg2+.

