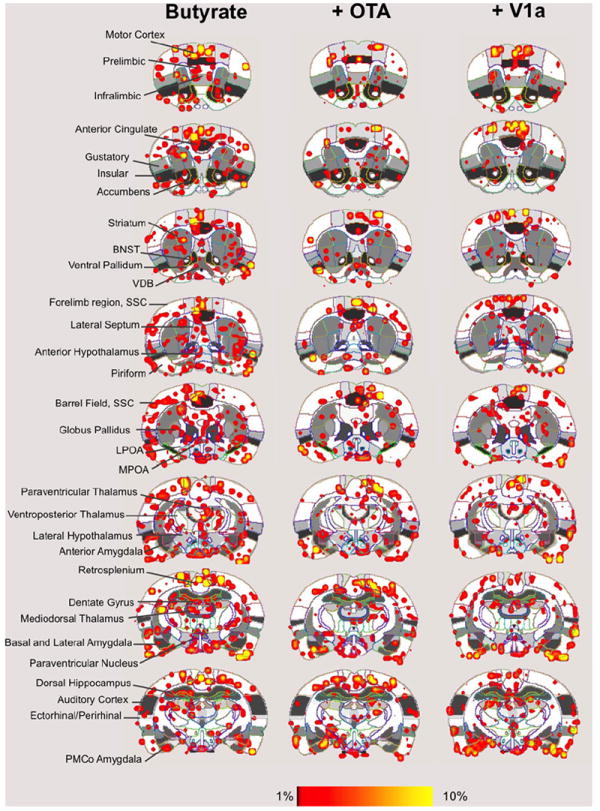
Fig. 2.

Butyric acid induced neural activity in the awake rat. Shown are composite maps for significant increases in signal intensity during presentation of air containing 5 uL 170 mM butyrate (airflow rate 1200 cc/min). Ninety minutes before behavioral testing, rats received a 10 uL intracerebroventricular injection of CSF (left column images), an oxytocin antagonist (+OT-A) or a vasopressin V1a receptor antagonist (+V1a). Overlay coloring threshold is set between 1% and 10% signal changes. Left column indicates specific regions of interest. (For interpretation of the references to color in this figure legend, the reader is referred to the web version of this article.)
