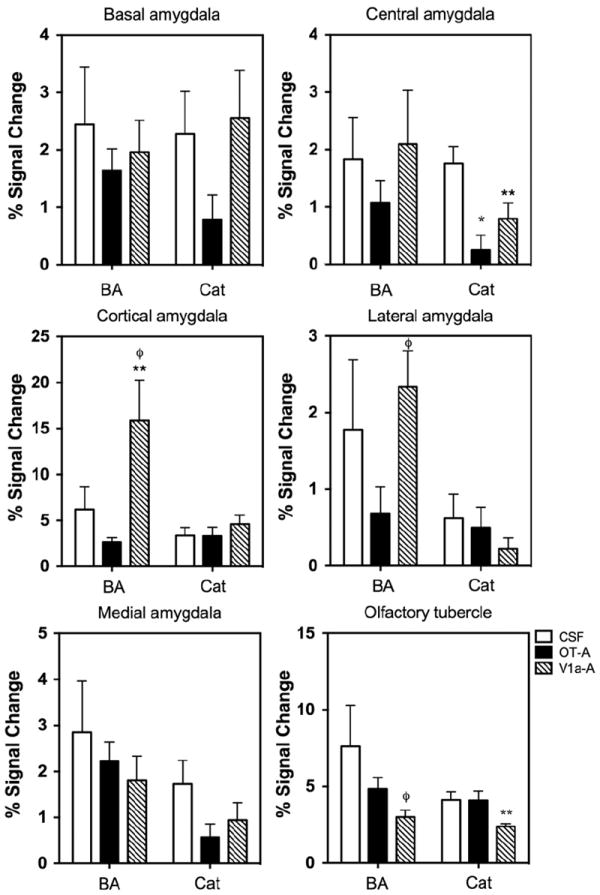
Fig. 4.

BOLD signal changes in response to a novel butyric acid odor and cat fur odor. Shown are subnuclei of the amygdala and the lower right panel shows data for the olfactory tubercle. All data presented as mean±standard error. Each panel shows the mean percent change in BOLD signal in response to butyric acid and cat fur for CSF, OT-A and V1a-A treated animals. *OT-A significantly different from CSF, **V1a-A significantly different from CSF and φV1a-A significantly different from OT-A (Two way ANOVA p<0.05).
