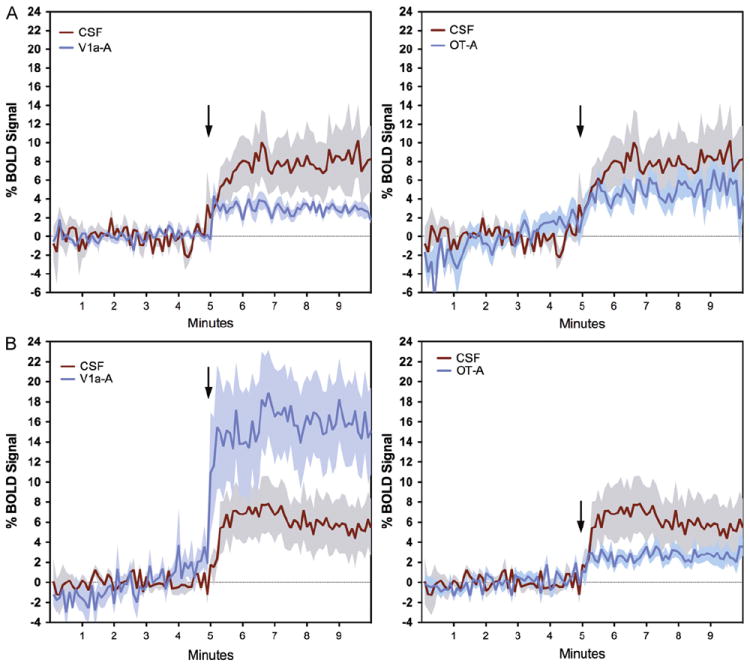
Fig. 5.

Temporal profile of the BOLD signal change in response to butyric acid odor. Data are shown for the olfactory tubercle (A) and the cortical amygdala (B). Shaded areas surrounding plot lines indicate±standard error. Arrows show the time of onset of odor delivery.
