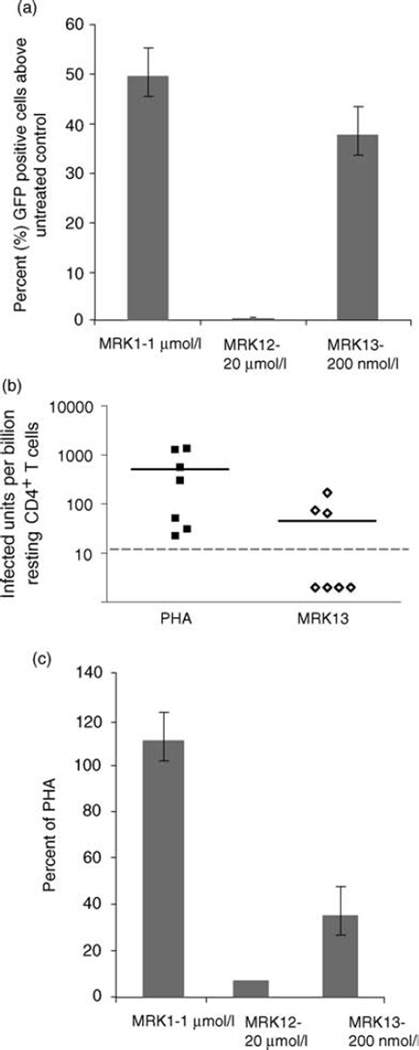
Fig. 4. HIV expression and outgrowth is induced by inhibitors targeting HDACs 1, 2, and 3, but viral outgrowth is markedly improved by the tandem inhibition of HDAC1–2 and the class II HDAC6.
(a) J89 cells were incubated overnight with 1 µmol/l MRK 1 (selective for HDAC1, 2, 3 and 6), 2–20 µmol/l MRK 12 (HDAC1 and 2) or 200 nmol/l MRK 13 (HDAC1, 2, 3). LTR-driven GFP production was measured by flow cytometry as described in methods. The data presented are the mean ± SE of three independent experiments. (b) Resting CD4+ T cells from patients were subjected to maximum mitogen stimulation or exposed to 200–300 nmol/l MRK 13 for 24 h. Cells were washed and co-cultured with CD8-depleted PBMC as described in methods. Frequency of virus outgrowth from cells treated with MRK 13 was compared to outgrowth after maximal mitogen activation. Each icon represents independent studies of patient cell samples; patient samples were simultaneously tested with mitogen or HDACi on the same day. Dashed lines indicate the limit of detection of the assay. (c) Frequency of virus outgrowth from resting CD4+ T cells of aviremic HIV+ patients exposed to 2 µmol/l MRK 1, 2–20 µmol/l MRK 12 and 300 nmol/l MRK 13 are shown as a percentage of outgrowth obtained from corresponding maximal mitogen activation by PHA. MRK 1, n = 8; MRK 12, n = 2; MRK 13, n = 7. GFP, green florescence protein; HDAC, histone deacetylase; LTR, long terminal repeat; PBMC, peripheral blood mononuclear cell.

