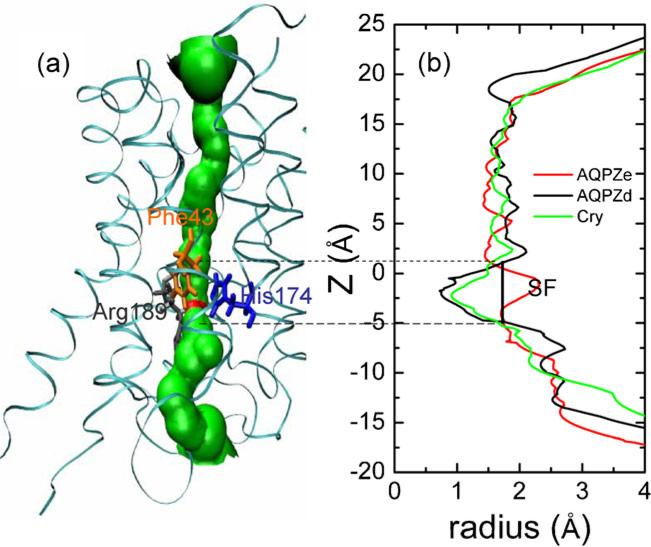
Fig. 4.
Structural representation a shows the position of the water pore in red and green colors. AQPZ is shown as ribbons. The residues (Phe 43, His174, and Arg189) are shown as licorice, and each residue of interest is colored individually. Plot b shows the pore radii for AQPZd (black line), AQPZe (red line), and the crystallographic structure (green line) along the channel axis. The SF region is labeled

