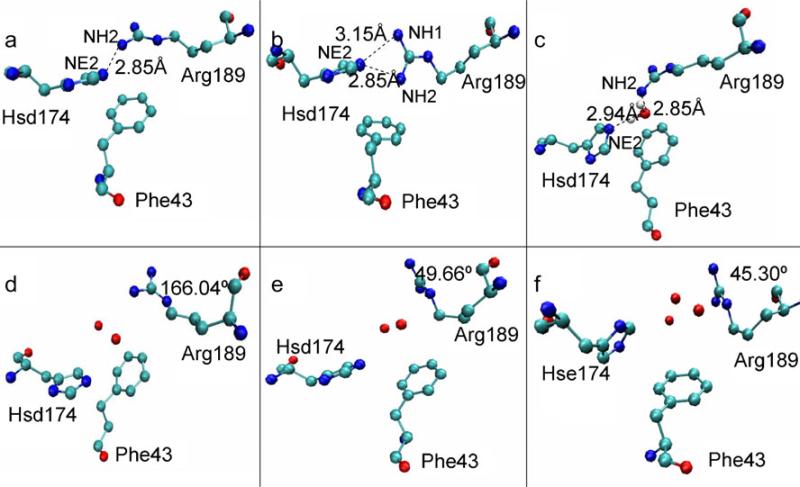
Fig. 8.
The conformations of the three residues in the SF region. The snapshots are taken from the last 10 ns of MD simulation. The three residues and the water molecules are shown in ball-and-stick representation and each element is shown in a different color. The distances between the hydrogen-bond donor and acceptor and the dihedral angles <Cβ–Cγ–Cδ–Nε of Arg189 are also marked

