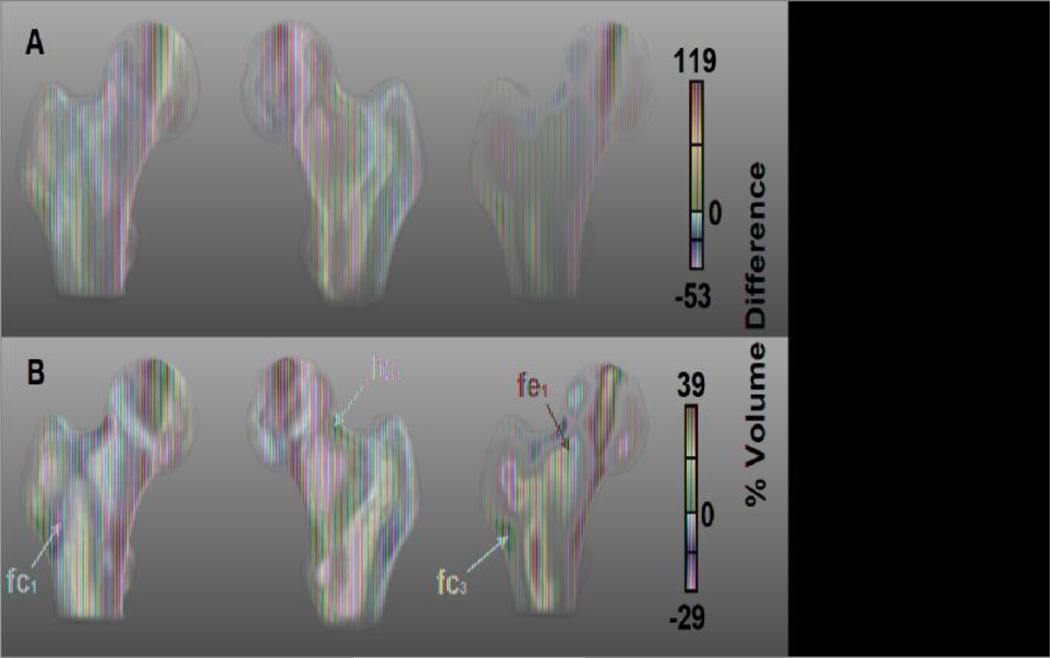
Figure 4.
Anterior, posterior, and coronal cross-sectional views of fracture-related morphometric features in the proximal femur. The maps depict mean local volume differences of the fracture subgroup with respect to the control subgroup, both from the Fracture Study. Magenta and red arrows point to regions where the fracture subgroup showed local volume contractions and expansions, respectively. Maps in A use the color scale of Figure 3, which corresponds to the dynamic range of the comparison between older and young women from the Aging Study. Maps in B use the color scale corresponding to the dynamic range of the comparison between control and fracture women from the Fracture Study. Differences were calculated prior to the application of the logarithm.

