Fig. 1.
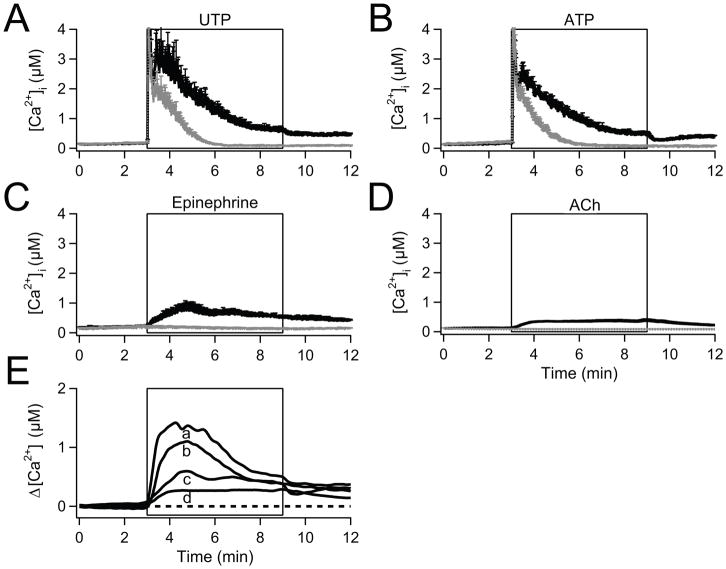
Activation of SOC by physiological agonists applied to isolated PDEC. Traces are time courses of [Ca2+]i measured ratiometrically using Fura-2. (A) Averaged [Ca2+]i increase evoked by 100 μM UTP with (black line, n = 10) and without Ca2+ in the bathing medium (gray line, n = 10). (B) Similar experiments with 100 μM ATP (n = 8, black line; n = 8, gray line). (C) 1 μM epinephrine (n = 5, black line; n = 4, gray line). (D) 100μM acetylcholine (ACh; n = 20, black line; n = 16, gray line). (E) Difference [Ca2+]i traces (with-Ca2+ minus without-Ca2+) reflecting the relative contribution of Ca2+ influx calculated for UTP (a), ATP (b), epinephrine (c), and acetylcholine (d). The broken line indicates the base level.

