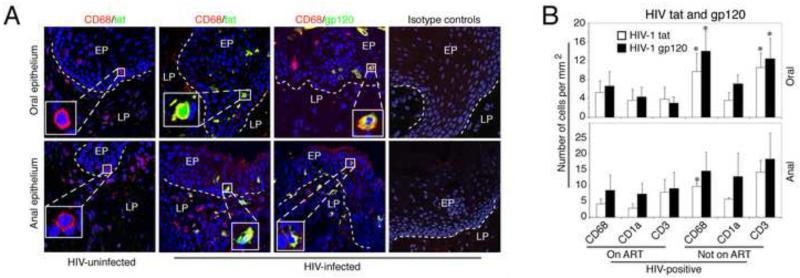
Fig. 5.
Distribution of HIV-tat- and gp120- expressing immune cells in oral and anal epithelia of HIV- infected individuals. (A) Oral and anal tissue sections from HIV-uninfected and -infected individuals were co-immunostained for HIV-tat or gp120 (both in green) and CD68 (in red), a marker for macrophages. Yellow indicates co-localization of viral proteins with cellular markers. Nuclei are in blue (A-C). EP, epithelium; LP, lamina propria. The dotted white line indicates the boundary between the epithelium and the lamina propria. Original magnification was ×400. Representative immunofluorescence images are shown. (B) For quantitative evaluation, we counted CD3-, CD68-, and CD1a-positive cells expressing HIV-tat or gp120 in oral and anal tissue sections obtained from HIV-infected individuals on ART (6 oral and 6 anal biopsies) and not on ART (6 oral and 3 anal biopsies). Cells expressing HIV tat and gp120 were counted in 10 microscopic fields, and results are represented as the average number of cells per mm2. Error bars show the standard error of means. P<0.05, **P<0.01, ***P<0.001, all compared with control group.

