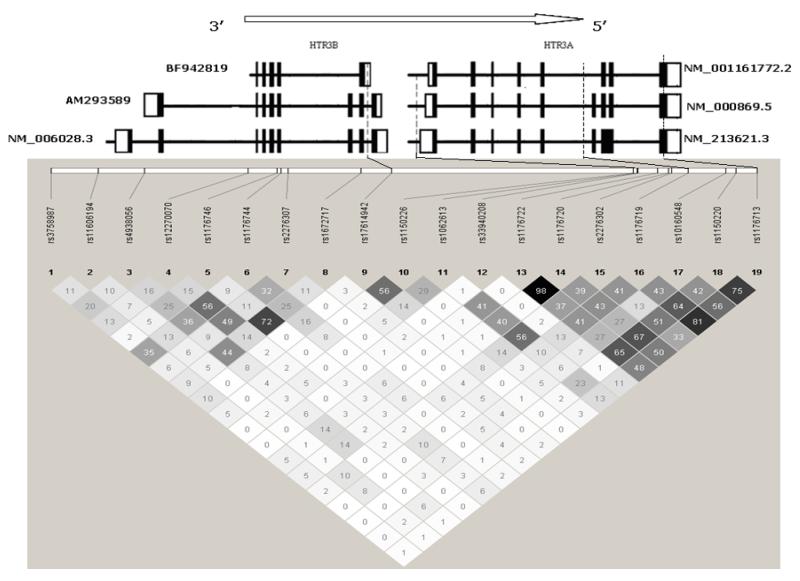
Figure 3.
Linkage disequilibrium analysis of all HTR3AB single-nucleotide polymorphisms (SNPs) in the total cohort and the location of significantly associated SNPs.
Footnote: Values in squares of the linkage disequilibrium plot are r2 numbers: The dotted lines point toward the location of significantly associated SNPs in reference to various splice variants of HTR3A and HTR3B primary mRNA. The numbers next to each splice variant indicate their accession numbers.

