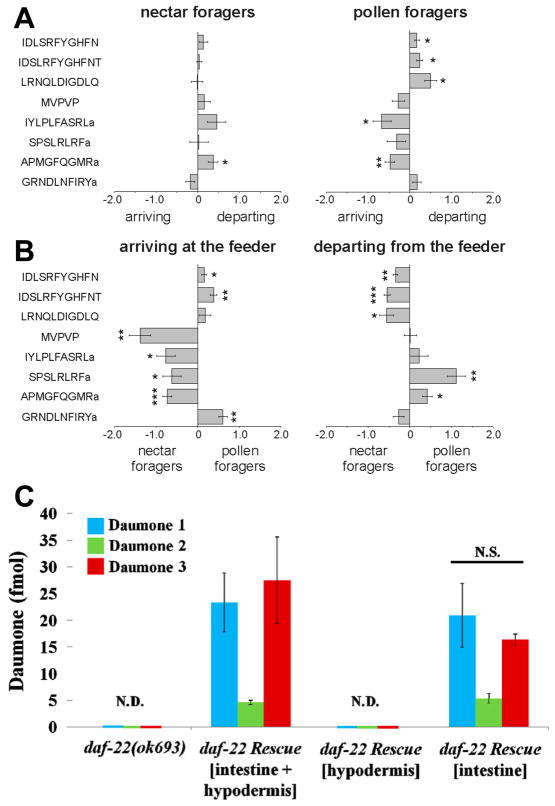
Figure 3.
Differences in brain peptide abundances between four behaviorally different honey bee forager groups. A) Relative differences in peptide abundances between arriving and departing nectar or pollen foragers. B) Relative differences in peptide abundances between nectar and pollen foragers arriving or departing from the feeder. x axis: normalized, log2 transformed and centered peptide ratios. Negative and positive values indicate the direction of change. MVPVP = MVPVPVHHMADELLRNGPDTVI. Indicated significance levels (Student’s t test): *, P < 0.05; **, P < 0.005; ***, P < 0.0005. Used with permission from ref. [12]. C)Absolute quantitation of daumone pheromone using stable isotope internal standard. The amount of pheromones (in 2 μL injection volume) in daf-22rescue worms. Quantitation was performed for three pheromones present in the wormbody of 20 young adult worms each, from the daf-22 (ok693)and the daf-22 rescue strains. Values represent means ± standard deviation from four independent sets. N.D., “not detected”; N.S., “not significant” relative to the amount of pheromones in the daf-22 rescue worms (intestinal and hypodermal). (Used with permission from ref. [27]. Copyright 2013 American Chemical Society.)

