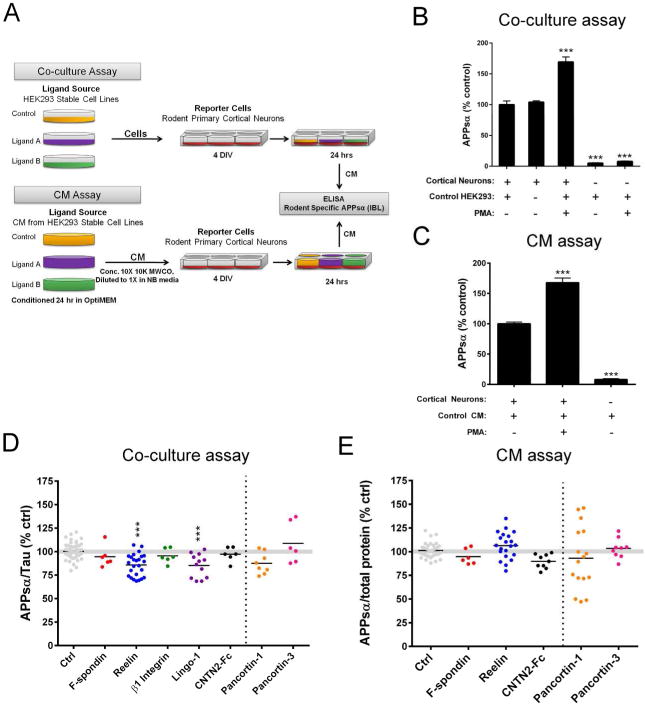
Figure 3. Effects of candidate ligands on APPsα levels in primary cortical cultures.
(A) Schematic of methods used for co-culture and CM assays. (B-C) Positive controls (PMA treatment) and negative controls (neurons and HEK293 cells alone) for the co-culture (B) and CM (C) assays. (D) ELISA quantification of APPsα (endogenous, rodent) secreted from cortical neurons co-cultured with HEK293 cells stably expressing ligand of interest. (E) ELISA quantification of APPsα (endogenous, rodent) secreted from cortical neurons treated with CM from HEK293 cells expressing ligand of interest. Error bars represent s.e.m.; * p<.05

