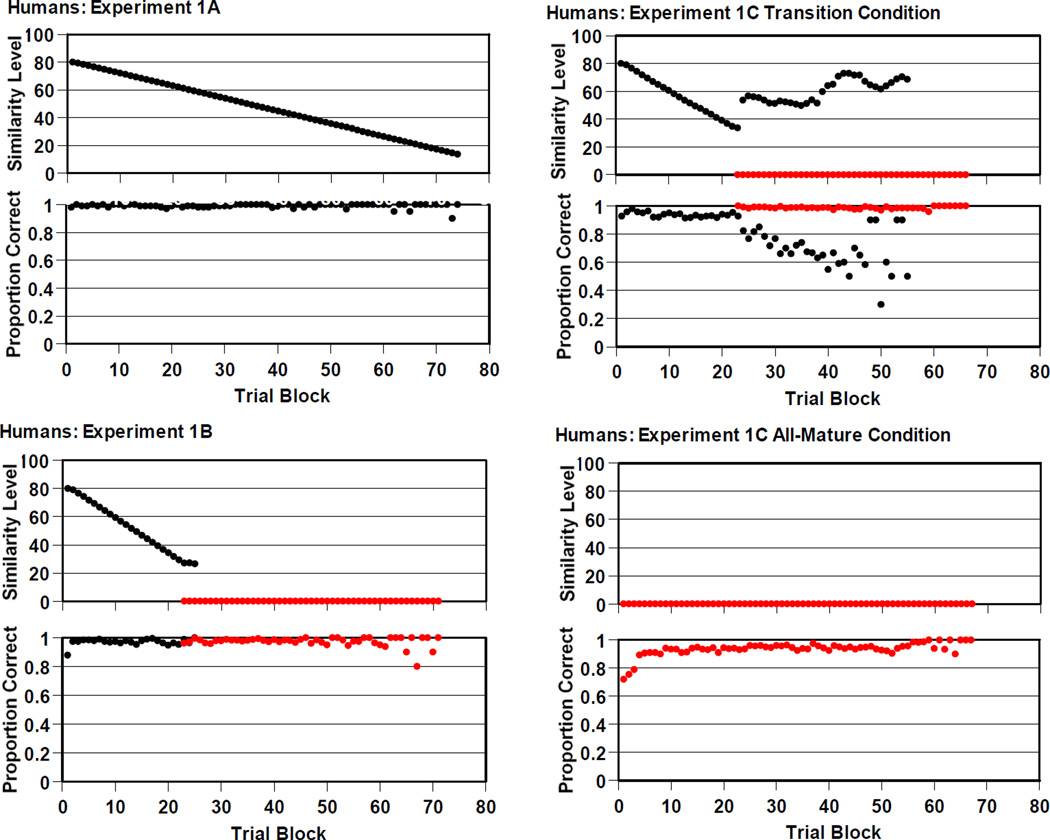
Figure 2.
Humans’ performance by 10-trial block in the RMTS task of Experiments 1A (top-left panels), 1B (bottom-left panels), and 1C (top-right and bottom-right panels). In The top panel gives the average level of perceptual support they experienced at each trial block. The definition of these levels of perceptual support is given in the text. The bottom panel gives humans’ proportion correct for trials in each trial block. The red symbols summarized performance for the zero-similarity RMTS trials that offered no perceptual support.

